VMware SSL Certificate Automation Tool – fails at vCenter Server

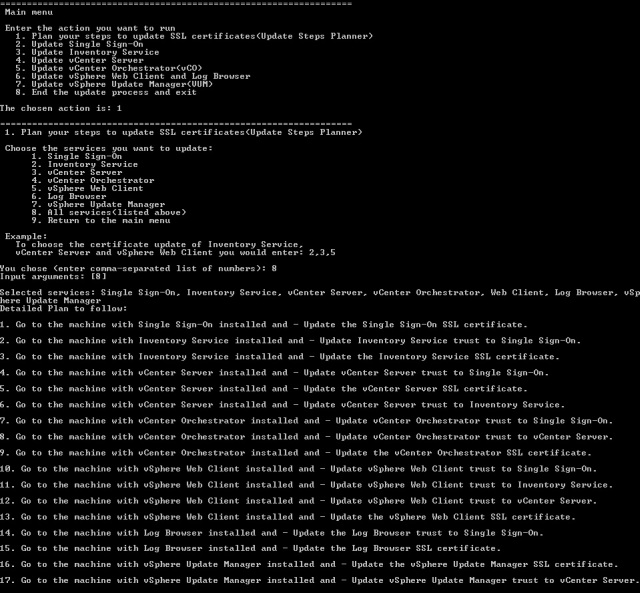
Früher setzte VMware noch mehr auf selbst erstellte Zertifikate zur Absicherung der vielen verschiedenen Serverdiensten. Doch mittlerweile ist für viele wie z.B. VMware Horizon View ein von einer Zertifizierungsstelle erzeugtes Zertifikat notwendig. Fängt man einmal mit dem Signieren an kommt man auch nicht mehr groß um die anderen Dienste herum. ESXi Server, vCenter Server, SSO Server, Update Manager, Inventory Dienst, Site Recovery Manager und noch viele mehr können bzw. müssen dementsprechend auch mit eigenen Zertifikaten versorgt werden.
Um dem Chaos etwas entgegen zu wirken hat VMware ein kleines Kommandozeilentool veröffentlicht – das VMware SSL Certificate Automation Tool. Momentan in der Version 1.0.1 bei VMware verfügbar.
2044696-examplecsr
 
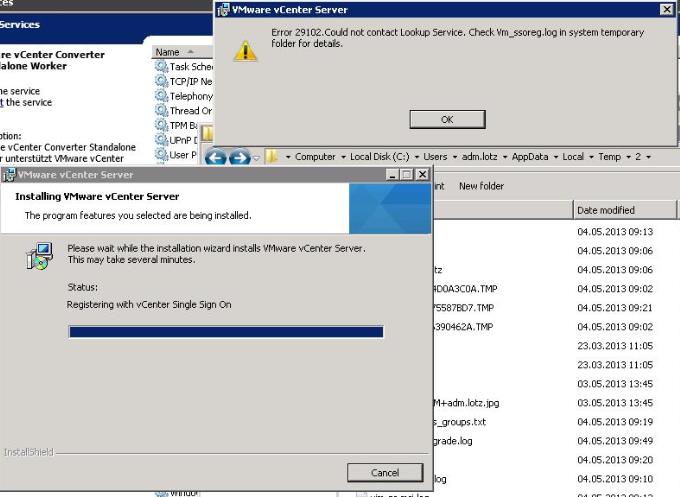
Beim Updaten des vCenter Server Zertifikats bin ich auf folgenden Fehler gestoßen:

[19.06.2013 - 10:48:11,31]: ""Cannot reload the vCenter Server SSL certificates. The certificate might not be unique.""
[19.06.2013 - 10:48:11,31]: Deleting the new certificates and keys...
[19.06.2013 - 10:48:11,33]: Restoring the original certificates and keys...
1 file(s) copied.
1 file(s) copied.
1 file(s) copied.
[19.06.2013 - 10:48:11,36]: The vCenter certificate update failed.

[Expand Vollständiges Log]
[19.06.2013 – 10:48:04,48]: Validating Lookup Service connection
Intializing registration provider…
Getting SSL certificates for https://server.domain.info:7444/lookupservice/sdk
Getting SSL certificates for https://server.domain.info:7444/sso-adminserver/sdk
Getting SSL certificates for https://server.domain.info:7444/ims/STSService?wsdl
Successfully created dummy service, we have sufficient privileges
Successfully deleted dummy service, we have sufficient privileges
The file C:\tool\backup\VC\ROOT_LS_SSL_CHAIN.crt already exists. Overwriting…
The file C:\tool\backup\VC\1_LS_SSL_CHAIN.crt already exists. Overwriting…
Certificates saved successfully
Return code is: Success
[19.06.2013 – 10:48:09,05]: Cleaning any temporary files
[19.06.2013 – 10:48:09,05]: Backing up the certificates and keys from „C:\ProgramData\VMware\VMware VirtualCenter\SSL…“
1 file(s) copied.
1 file(s) copied.
1 file(s) copied.
[19.06.2013 – 10:48:09,08]: Copying the new certificates and keys to „C:\ProgramData\VMware\VMware VirtualCenter\SSL…“
[19.06.2013 – 10:48:09,10]: Creating the PKCS certificate file…
Could not reload vCenter SSL Certificates
[19.06.2013 – 10:48:10,35]: „“Cannot reload the vCenter Server SSL certificates. The certificate might not be unique.““
[19.06.2013 – 10:48:10,36]: Deleting the new certificates and keys…
[19.06.2013 – 10:48:10,36]: Restoring the original certificates and keys…
1 file(s) copied.
1 file(s) copied.
1 file(s) copied.
[19.06.2013 – 10:48:10,41]: Attempting rollback…
Could not reload vCenter SSL Certificates
[19.06.2013 – 10:48:11,31]: „“Cannot reload the vCenter Server SSL certificates. The certificate might not be unique.““
[19.06.2013 – 10:48:11,31]: Deleting the new certificates and keys…
[19.06.2013 – 10:48:11,33]: Restoring the original certificates and keys…
1 file(s) copied.
1 file(s) copied.
1 file(s) copied.
[19.06.2013 – 10:48:11,36]: The vCenter certificate update failed.
[/Expand]
Bei der Ursachenforschung bin ich auf einen hilfreichen Post in der Community gestoßen. Dort wird beschrieben, dass das Problem offenbar an einer fehlerhaften Zuordnung des LookupService mit dem vCenter liegt.
Behoben werden kann der Fehler durch das einsetzen der korrekten ID des LookupService in die vpxd.cfg des vCenter Servers.
Hier die Anleitung:

Steps:
1. Stop vCenter service
2. Look for your ID in LS_ServiceID.prop in folder C:\ProgramData\VMware\VMware VirtualCenter
3. Copy this ID (e.g. {C4672589-9258-42B1-90E2-1EF268BBD402}:5 )
4. Edit your vpxd.cfg in the same folder and replace
<serviceId>vCenterService</serviceId>
with
<serviceId>your ID</serviceId>
5. Start vCenter Service
Then the SSL automation tool works!
You don't need to revert the changes.

Anschließend hat auch das Updaten des Zertifikates mittels des SSL Certificate Automation Tool geklappt.
[Expand Komplettes Logfile]
#####################################
[19.06.2013 – 11:00:22,03]: Validating Lookup Service connection
Intializing registration provider…
Getting SSL certificates for https://server.domain.info:7444/lookupservice/sdk
Getting SSL certificates for https://server.domain.info:7444/sso-adminserver/sdk
Getting SSL certificates for https://server.domain.info:7444/ims/STSService?wsdl
Successfully created dummy service, we have sufficient privileges
Successfully deleted dummy service, we have sufficient privileges
The file C:\tool\backup\VC\ROOT_LS_SSL_CHAIN.crt already exists. Overwriting…
The file C:\tool\backup\VC\1_LS_SSL_CHAIN.crt already exists. Overwriting…
Certificates saved successfully
Return code is: Success
[19.06.2013 – 11:00:26,72]: Cleaning any temporary files
[19.06.2013 – 11:00:26,75]: Backing up the certificates and keys from „C:\ProgramData\VMware\VMware VirtualCenter\SSL…“
1 file(s) copied.
1 file(s) copied.
1 file(s) copied.
[19.06.2013 – 11:00:26,77]: Copying the new certificates and keys to „C:\ProgramData\VMware\VMware VirtualCenter\SSL…“
[19.06.2013 – 11:00:26,80]: Creating the PKCS certificate file…
Successfully reloaded vCenter SSL Certificates
[19.06.2013 – 11:00:31,98]: Encrypting the password with the certificates…
—— In-memory logs start ——–
mem> 2013-06-19T11:00:32.172+02:00 [04384 info ‚Hooks‘] Hooks Initialized
—— In-memory logs end ——–
2013-06-19T11:00:32.187+02:00 [04384 info ‚Default‘] Logging uses fast path: true
2013-06-19T11:00:32.187+02:00 [04384 info ‚Default‘] Handling bora/lib logs with VmaCore facilities
2013-06-19T11:00:32.187+02:00 [04384 info ‚Default‘] Initialized channel manager
2013-06-19T11:00:32.187+02:00 [04384 info ‚Default‘] Current working directory: C:\tool
2013-06-19T11:00:32.187+02:00 [04384 info ‚Default‘] ThreadPool windowsStackImmediateCommit = true
2013-06-19T11:00:32.187+02:00 [04384 info ‚ThreadPool‘] Thread enlisted
2013-06-19T11:00:32.187+02:00 [04384 info ‚Default‘] Log path: C:\ProgramData\VMware\VMware VirtualCenter\Logs
2013-06-19T11:00:32.187+02:00 [04384 info ‚Default‘] Initializing SSL
2013-06-19T11:00:33.248+02:00 [04384 info ‚Default‘] Vmacore::InitSSL: handshakeTimeoutUs = 120000000
2013-06-19T11:00:33.248+02:00 [06172 info ‚ThreadPool‘] Thread enlisted
2013-06-19T11:00:33.264+02:00 [04384 info ‚Default‘] Reset DB password succeeded.
[19.06.2013 – 11:00:33,26]: Setup complete. Restarting services…
[19.06.2013 – 11:00:33,27]: Restarting vCenter Server…
SERVICE_NAME: vctomcat
TYPE : 10 WIN32_OWN_PROCESS
STATE : 3 STOP_PENDING
(STOPPABLE, NOT_PAUSABLE, ACCEPTS_SHUTDOWN)
WIN32_EXIT_CODE : 0 (0x0)
SERVICE_EXIT_CODE : 0 (0x0)
CHECKPOINT : 0x17
WAIT_HINT : 0x0
[19.06.2013 – 11:00:33,29]: Stopping vCenter Web Services…
[19.06.2013 – 11:00:33,31]: „“Cannot stop the vCenter Server Web Services: 1″“
STATE : 1 STOPPED
SERVICE_NAME: vpxd
TYPE : 10 WIN32_OWN_PROCESS
STATE : 3 STOP_PENDING
(STOPPABLE, NOT_PAUSABLE, ACCEPTS_SHUTDOWN)
WIN32_EXIT_CODE : 0 (0x0)
SERVICE_EXIT_CODE : 0 (0x0)
CHECKPOINT : 0x0
WAIT_HINT : 0x124f80
[19.06.2013 – 11:00:38,19]: Stopping vCenter Server…
[19.06.2013 – 11:00:38,22]: „“Cannot stop vCenter Server: 1″“
[19.06.2013 – 11:00:43,15]: „“Cannot stop vCenter Server: 1″“
[19.06.2013 – 11:00:48,19]: „“Cannot stop vCenter Server: 1″“
[19.06.2013 – 11:00:53,15]: „“Cannot stop vCenter Server: 1″“
[19.06.2013 – 11:00:58,20]: „“Cannot stop vCenter Server: 1″“
[19.06.2013 – 11:01:03,15]: „“Cannot stop vCenter Server: 1″“
[19.06.2013 – 11:01:08,19]: „“Cannot stop vCenter Server: 1″“
[19.06.2013 – 11:01:13,22]: „“Cannot stop vCenter Server: 1″“
[19.06.2013 – 11:01:18,17]: „“Cannot stop vCenter Server: 1″“
[19.06.2013 – 11:01:23,22]: „“Cannot stop vCenter Server: 1″“
[19.06.2013 – 11:01:28,18]: „“Cannot stop vCenter Server: 1″“
[19.06.2013 – 11:01:33,22]: „“Cannot stop vCenter Server: 1″“
[19.06.2013 – 11:01:38,17]: „“Cannot stop vCenter Server: 1″“
STATE : 1 STOPPED
SERVICE_NAME: vpxd
TYPE : 10 WIN32_OWN_PROCESS
STATE : 2 START_PENDING
(STOPPABLE, NOT_PAUSABLE, ACCEPTS_SHUTDOWN)
WIN32_EXIT_CODE : 0 (0x0)
SERVICE_EXIT_CODE : 0 (0x0)
CHECKPOINT : 0x0
WAIT_HINT : 0x124f80
PID : 4616
FLAGS :
[19.06.2013 – 11:01:43,36]: Starting vCenter Server…
[19.06.2013 – 11:01:43,38]: „“Cannot start vCenter Server: 1″“
[19.06.2013 – 11:01:48,14]: „“Cannot start vCenter Server: 1″“
[19.06.2013 – 11:01:53,17]: „“Cannot start vCenter Server: 1″“
STATE : 4 RUNNING
SERVICE_NAME: vctomcat
TYPE : 10 WIN32_OWN_PROCESS
STATE : 2 START_PENDING
(NOT_STOPPABLE, NOT_PAUSABLE, IGNORES_SHUTDOWN)
WIN32_EXIT_CODE : 0 (0x0)
SERVICE_EXIT_CODE : 0 (0x0)
CHECKPOINT : 0x0
WAIT_HINT : 0x7d0
PID : 6168
FLAGS :
[19.06.2013 – 11:01:58,24]: Restarting vSphere Profile-Driven Storage Service…
SERVICE_NAME: vimPBSM
TYPE : 10 WIN32_OWN_PROCESS
STATE : 3 STOP_PENDING
(STOPPABLE, NOT_PAUSABLE, ACCEPTS_SHUTDOWN)
WIN32_EXIT_CODE : 0 (0x0)
SERVICE_EXIT_CODE : 0 (0x0)
CHECKPOINT : 0x3f
WAIT_HINT : 0x0
[19.06.2013 – 11:01:58,27]: „“Cannot stop vSphere Profile-Driven Storage Service: 1″“
STATE : 1 STOPPED
SERVICE_NAME: vimPBSM
TYPE : 10 WIN32_OWN_PROCESS
STATE : 2 START_PENDING
(NOT_STOPPABLE, NOT_PAUSABLE, IGNORES_SHUTDOWN)
WIN32_EXIT_CODE : 0 (0x0)
SERVICE_EXIT_CODE : 0 (0x0)
CHECKPOINT : 0x0
WAIT_HINT : 0x7d0
PID : 4644
FLAGS :
[19.06.2013 – 11:02:03,24]: vCenter certificates updated.
[/Expand]
 

VMware View – VM Status: "bereits verwendet" bzw. "already used" beheben

VMWare-View2Seit VMware (Horizon) View 5.1.2 bzw. 5.2 gibt es ein neues Feature zum Umgang mit Virtuellen Maschinen im Status „already used“ bzw. „bereits verwendet“.
Wird ein Benutzer nicht korrekt abgemeldet oder die Aufräumarbeiten des View Agent nicht erfolgreich abgeschlossen wird eine Virtuelle Maschine automatisch in diesen Status versetzt.
Dies ist ein Sicherheitsfeatures, welches nur aktiv ist, wenn bei dem betreffendem Pool die Einstellung „Delete or refresh desktop on logoff“ auf Delete oder Refresh gesetzt ist.
Das Problem an der Sache, dass (warum auch immer) Virtuelle Maschinen im Status „bereits verwendet“ zu angeschalteten bzw. zur Gruppe der verfügbaren VM’s zählt. Dadurch passiert es schnell, dass keine VM anmeldebereit ist aber auch keine weitere mehr angeschaltet wird, obwohl eigentlich noch genügend VM’s (ausgeschaltet) bereitgestellt sind.
Jedenfalls kann man sich jetzt Abhilfe schaffen indem man für seine Pool’s die neu eingeführte „Dirty VM Policy“ benutzt. Dies ist eine ADAM Regel welche über das Setzen des LDAP-Attributes „pae-DirtyVmPolicy“ bei dem entsprechendem Pool greift.
Die Regel greift nur wenn:

A. The desktop session has ended
B. There are no active session either ‘Connected’ or ‘Disconnected’
C. The VM has been marked as ‘dirty’. A VM is marked as ‘dirty’, once a connection has been made to it at least once.

Es gibt 3 mögliche Optionen, wie mit den VM’s umgegangen werden soll:
1. Block access and keep for manual cleanup

By default, the Dirty VM policy will be unset, and the pae-DirtyVMPolicy will have a value ‘0’. Any
‘Single use pool’ VM that skipped the clean-up action because of any reason will be marked as
‘Already Used’
This is recommended for scenarios where administrators do not wish to allow users to get to each
other's data, but also to protect the VMs from data loss in case something does go wrong.

2. Ignore the previous usage and allow access

To ignore the previous VM usage and make it as change the pae-DirtyVMPolicy to ‘1’. With this
configuration and any single use pool VM that misses the cleanup action will be declared as available,
and will allow access to upcoming desktop launch requests.
This is recommended for administrators those who don’t care about the occasional user profile
overlap. This way Administrator can maximize the usage of the pool

3. Forcefully cleanup and declare as available

To perform an aggressive cleanup action (delete or refresh the VM as configured for the pool); set the
pae-DirtyVMPolicy valure to ‘2’. This will ensure no VMs left as “Already Used” and address the user
profile /data overlap issues when gets assigned to another user.
This is recommended for administrators who decide to automatically cleaning up a VM where
something have gone wrong may mean the loss of important logs/data but value maximum pool usage
higher.

dirtyVmpolicy

VMware ESXi 5 Server mit Cacti überwachen

Vorab – dazu gibt es schon einen Beitrag und zwar vom Ersteller des Templates Nitro bzw. Hypervisor.fr
Wie die Domainendung schon zu vermuten gibt aber leider in Französisch. Ich übersetzte die Anleitung sozusagen nur grob und funktional 🙂
Cacti ist die Monitoringsoftware schlecht hin. Wer sich mit MRTG auseinandergesetzt hat wird es kennen, stundenlang in Konfigurationsdateien herum zu editieren. Da ist Cacti doch eine wesentlich ansprechendere, schnellere, und einfachere Lösung.
Natürlich versucht man alle wichtigen Systeme im Monitoring zu haben. Wie man den ESXi Server auch in die Nagios bzw. Centreon Überwachung aufnehmen kann habe ich euch bereits hier beschrieben. Die Methode ist die Gleiche – basierend auf der vSphere Perl SDK und des check_vmware_api Script.
1. Voraussetzungen
Ihr benötigt die VMware vSphere Perl SDK, sowie die notwendigen Perl Module etc. um das check_vmware_api Script zum Laufen zu bekommen.
Wie das geht, habe ich euch hier in einem separatem Beitrag bereits beschrieben.
Seit ihr soweit dass ihr das Script von Hand laufen lassen könnt, gehts hier weiter.
2. vi_host Paket herunterladen:
http://files.hypervisor.fr/scripts/check_vmware_api.zip
3. Die beiden Dateien müssen in das Cacti Script_Queries Verzeichnis kopiert werden. – Standard ist /var/www/cacti/resource/script_queries/

check_vmware_cluster.xml
check_vmware_datastore.xml

4. Die Datei check_esx3_helper.sh muss in das Verzeichnis kopiert werden:

/var/www/cacti/scripts

5. Nun das check_vmware_api Script von op5 herunterladen und ebenfalls in das Verzeichnis kopieren:

/var/www/cacti/scripts

6. Die beiden anderen Dateien importiert ihr ins Cacti:

cacti_data_query_vmware_vpx_-_cluster_usage.xml
cacti_data_query_vmware_vpx_-_vmfs_usage.xml

import-template-cacti-esxi
7. Nachdem nun die Templates importiert sind, müssen diese mit dem vCenter verknüpft werden:
cacti_host_view
8. Logindaten fürs vSphere eingeben
Die Anmeldeinformationen werden anhand der SNMP v3 Logindaten ausgelesen. Sollte man also sein vCenter Server bereits via SNMP überwachen, dann muss man im Cacti dafür ein extra Gerät anlegen, damit man beide SNMP Einstellungen benutzten kann.
snmp-v3-cacti
9. Anschließend die Graphen erstellen:
cacti_graph_view
10. Rundum sollte es dann nach einer Zeit so aussehen:
cacti_cluster_view
Die Bilder sind teilweise kopiert von: http://www.hypervisor.fr/?p=3896

VMware ESXi 5 mit Nagios/Centreon überwachen

VMware bietet mit seinem vSphere Client bzw. des vSphere Webclient eine schönes Tool zur Verwaltung der ESX Farm. Dort kann man sich auch die Performancewerte zu CPU, Ram, HDD, Netzwerk anschauen, Graphen erzeugen und vieles mehr…. Wer jetzt aber ein bestehendes System zum Monitoren hat, freut sich mit Sicherheit darüber, dort auch alle Systeme aufnehmen zu können.
Da seit dem ESX3 die SNMP Funktionalität bzw. alle nützlichen Attribute daraus gänzlich entfernt wurden, bleibt zum Abfragen nur die PowerCLI bzw. die Perl SDK. Wie das funktioniert beschreibe ich hier:
Als erstes die aktuellste VMware vSphere Perl SDK installieren. Momentan 5.1.0 – gibt’s bei VMware.
Entpacken:

tar xvf VMware-vSphere-Perl-SDK-5.1.0-780721.x86_64.tar.gz

Umgebungsvariablen setzen: (WICHTIG – ohne geht’s nicht!)

export http_proxy=
export ftp_proxy=

Installer ausführen:

sudo ./vmware-install.pl

Perl Module installieren:

perl -MCPAN -e shell

Anschließend für die unten aufgelisteten Module jeweils machen:

install XML::Simple
XML::Simple
Nagios::Plugin
Class::MethodMaker
URI
LWP
HTML::Parser

Das Nagios Plugin / Script herunterladen: check_vmware_api
Jetzt noch die SSL Überprüfung vom LWP Modul zu deaktivieren. Ich empfehle folgendes noch in den Kopfbereich des check_vmware_api Scriptes hinzuzufügen:

$ENV{PERL_LWP_SSL_VERIFY_HOSTNAME} = 0;

Alternativ kann man die Einstellung auch Global vornehmen:

sudo vim /usr/share/perl5/LWP/Protocol/https.pm

In der Datei nach der Zeile:

$ssl_opts{SSL_verify_mode} ||= 1;

suchen und diese durch folgende ersetzen:

$ssl_opts{SSL_verify_mode} ||= 0;

Ansonsten bekommt ihr eventuell folgende Fehlermeldung:

CHECK_ESX3.PL CRITICAL - Server version unavailable at 'https://MYESX:443/sdk/vimService.wsdl' at /usr/lib/perl5/5.10.0/VMware/VICommon.pm line 545.

Zum Testen kann man sich nun mal den Gesamtverbrauch an CPU Ressourcen in MHZ ausgeben lassen:

root@SERVER:/# /usr/local/nagios/libexec/check_esx3.pl -D vcenter.domain.info -u user@domain.info -p password -l cpu -s usagemhz
CHECK_ESX3.PL OK - cpu usagemhz=31792.00 MHz | cpu_usagemhz=31792.00Mhz;;

Insgesamt gibt es sehr viele Optionen, die komplette Liste gibts hier:
[EXPAND check_vmware_api Befehle]
check_esx3.pl 0.7.0
This nagios plugin is free software, and comes with ABSOLUTELY NO WARRANTY.
It may be used, redistributed and/or modified under the terms of the GNU
General Public Licence (see http://www.fsf.org/licensing/licenses/gpl.txt).
VMWare Infrastructure plugin
Usage: check_esx3.pl -D <data_center> | -H <host_name> [ -C <cluster_name> ] [ -N <vm_name> ]
-u -p | -f
-l [ -s ] [ -T ] [ -i ]
[ -x <black_list> ] [ -o <additional_options> ]
[ -t ] [ -w <warn_range> ] [ -c <crit_range> ]
[ -V ] [ -h ]
-?, –usage
Print usage information
-h, –help
Print detailed help screen
-V, –version
Print version information
–extra-opts=[section][@file]
Read options from an ini file. See http://nagiosplugins.org/extra-opts
for usage and examples.
-H, –host=
ESX or ESXi hostname.
-C, –cluster=
ESX or ESXi clustername.
-D, –datacenter=
Datacenter hostname.
-N, –name=
Virtual machine name.
-u, –username=
Username to connect with.
-p, –password= Password to use with the username.
-f, –authfile= Authentication file with login and password. File syntax :
username=
password= -w, –warning=THRESHOLD
Warning threshold. See
http://nagiosplug.sourceforge.net/developer-guidelines.html#THRESHOLDFORMAT
for the threshold format.
-c, –critical=THRESHOLD
Critical threshold. See
http://nagiosplug.sourceforge.net/developer-guidelines.html#THRESHOLDFORMAT
for the threshold format.
-l, –command=COMMAND
Specify command type (CPU, MEM, NET, IO, VMFS, RUNTIME, …)
-s, –subcommand=SUBCOMMAND
Specify subcommand
-S, –sessionfile=SESSIONFILE
Specify a filename to store sessions for faster authentication
-x, –exclude=<black_list>
Specify black list
-o, –options=<additional_options>
Specify additional command options (quickstats, …)
-T, –timestamp=
Timeshift in seconds that could fix issues with „Unknown error“. Use values like 5, 10, 20, etc
-i, –interval=
Sampling Period in seconds. Basic historic intervals: 300, 1800, 7200 or 86400. See config for any changes.
Supports literval values to autonegotiate interval value: r – realtime interval, h – historical interval specified by position.
Default value is 20 (realtime). Since cluster does not have realtime stats interval other than 20(default realtime) is mandatory.
-M, –maxsamples=
Maximum number of samples to retrieve. Max sample number is ignored for historic intervals.
Default value is 1 (latest available sample).
–trace=
Set verbosity level of vSphere API request/respond trace
-t, –timeout=INTEGER
Seconds before plugin times out (default: 30)
-v, –verbose
Show details for command-line debugging (can repeat up to 3 times)
Supported commands(^ – blank or not specified parameter, o – options, T – timeshift value, b – blacklist) :
VM specific :
* cpu – shows cpu info
+ usage – CPU usage in percentage
+ usagemhz – CPU usage in MHz
+ wait – CPU wait time in ms
+ ready – CPU ready time in ms
^ all cpu info(no thresholds)
* mem – shows mem info
+ usage – mem usage in percentage
+ usagemb – mem usage in MB
+ swap – swap mem usage in MB
+ swapin – swapin mem usage in MB
+ swapout – swapout mem usage in MB
+ overhead – additional mem used by VM Server in MB
+ overall – overall mem used by VM Server in MB
+ active – active mem usage in MB
+ memctl – mem used by VM memory control driver(vmmemctl) that controls ballooning
^ all mem info(except overall and no thresholds)
* net – shows net info
+ usage – overall network usage in KBps(Kilobytes per Second)
+ receive – receive in KBps(Kilobytes per Second)
+ send – send in KBps(Kilobytes per Second)
^ all net info(except usage and no thresholds)
* io – shows disk I/O info
+ usage – overall disk usage in MB/s
+ read – read latency in ms (totalReadLatency.average)
+ write – write latency in ms (totalWriteLatency.average)
^ all disk io info(no thresholds)
* runtime – shows runtime info
+ con – connection state
+ cpu – allocated CPU in MHz
+ mem – allocated mem in MB
+ state – virtual machine state (UP, DOWN, SUSPENDED)
+ status – overall object status (gray/green/red/yellow)
+ consoleconnections – console connections to VM
+ guest – guest OS status, needs VMware Tools
+ tools – VMWare Tools status
+ issues – all issues for the host
^ all runtime info(except con and no thresholds)
Host specific :
* cpu – shows cpu info
+ usage – CPU usage in percentage
o quickstats – switch for query either PerfCounter values or Runtime info
+ usagemhz – CPU usage in MHz
o quickstats – switch for query either PerfCounter values or Runtime info
^ all cpu info
o quickstats – switch for query either PerfCounter values or Runtime info
* mem – shows mem info
+ usage – mem usage in percentage
o quickstats – switch for query either PerfCounter values or Runtime info
+ usagemb – mem usage in MB
o quickstats – switch for query either PerfCounter values or Runtime info
+ swap – swap mem usage in MB
o listvm – turn on/off output list of swapping VM’s
+ overhead – additional mem used by VM Server in MB
+ overall – overall mem used by VM Server in MB
+ memctl – mem used by VM memory control driver(vmmemctl) that controls ballooning
o listvm – turn on/off output list of ballooning VM’s
^ all mem info(except overall and no thresholds)
* net – shows net info
+ usage – overall network usage in KBps(Kilobytes per Second)
+ receive – receive in KBps(Kilobytes per Second)
+ send – send in KBps(Kilobytes per Second)
+ nic – makes sure all active NICs are plugged in
^ all net info(except usage and no thresholds)
* io – shows disk io info
+ aborted – aborted commands count
+ resets – bus resets count
+ read – read latency in ms (totalReadLatency.average)
+ write – write latency in ms (totalWriteLatency.average)
+ kernel – kernel latency in ms
+ device – device latency in ms
+ queue – queue latency in ms
^ all disk io info
* vmfs – shows Datastore info
+ (name) – free space info for datastore with name (name)
o used – output used space instead of free
o breif – list only alerting volumes
o regexp – whether to treat name as regexp
o blacklistregexp – whether to treat blacklist as regexp
b – blacklist VMFS’s
T (value) – timeshift to detemine if we need to refresh
^ all datastore info
o used – output used space instead of free
o breif – list only alerting volumes
o blacklistregexp – whether to treat blacklist as regexp
b – blacklist VMFS’s
T (value) – timeshift to detemine if we need to refresh
* runtime – shows runtime info
+ con – connection state
+ health – checks cpu/storage/memory/sensor status
o listitems – list all available sensors(use for listing purpose only)
o blackregexpflag – whether to treat blacklist as regexp
b – blacklist status objects
+ storagehealth – storage status check
o blackregexpflag – whether to treat blacklist as regexp
b – blacklist status objects
+ temperature – temperature sensors
o blackregexpflag – whether to treat blacklist as regexp
b – blacklist status objects
+ sensor – threshold specified sensor
+ maintenance – shows whether host is in maintenance mode
+ list(vm) – list of VMWare machines and their statuses
+ status – overall object status (gray/green/red/yellow)
+ issues – all issues for the host
b – blacklist issues
^ all runtime info(health, storagehealth, temperature and sensor are represented as one value and no thresholds)
* service – shows Host service info
+ (names) – check the state of one or several services specified by (names), syntax for (names):,,…,
^ show all services
* storage – shows Host storage info
+ adapter – list bus adapters
b – blacklist adapters
+ lun – list SCSI logical units
b – blacklist LUN’s
+ path – list logical unit paths
b – blacklist paths
^ show all storage info
* uptime – shows Host uptime
o quickstats – switch for query either PerfCounter values or Runtime info
* device – shows Host specific device info
+ cd/dvd – list vm’s with attached cd/dvd drives
o listall – list all available devices(use for listing purpose only)
DC specific :
* cpu – shows cpu info
+ usage – CPU usage in percentage
o quickstats – switch for query either PerfCounter values or Runtime info
+ usagemhz – CPU usage in MHz
o quickstats – switch for query either PerfCounter values or Runtime info
^ all cpu info
o quickstats – switch for query either PerfCounter values or Runtime info
* mem – shows mem info
+ usage – mem usage in percentage
o quickstats – switch for query either PerfCounter values or Runtime info
+ usagemb – mem usage in MB
o quickstats – switch for query either PerfCounter values or Runtime info
+ swap – swap mem usage in MB
+ overhead – additional mem used by VM Server in MB
+ overall – overall mem used by VM Server in MB
+ memctl – mem used by VM memory control driver(vmmemctl) that controls ballooning
^ all mem info(except overall and no thresholds)
* net – shows net info
+ usage – overall network usage in KBps(Kilobytes per Second)
+ receive – receive in KBps(Kilobytes per Second)
+ send – send in KBps(Kilobytes per Second)
^ all net info(except usage and no thresholds)
* io – shows disk io info
+ aborted – aborted commands count
+ resets – bus resets count
+ read – read latency in ms (totalReadLatency.average)
+ write – write latency in ms (totalWriteLatency.average)
+ kernel – kernel latency in ms
+ device – device latency in ms
+ queue – queue latency in ms
^ all disk io info
* vmfs – shows Datastore info
+ (name) – free space info for datastore with name (name)
o used – output used space instead of free
o breif – list only alerting volumes
o regexp – whether to treat name as regexp
o blacklistregexp – whether to treat blacklist as regexp
b – blacklist VMFS’s
T (value) – timeshift to detemine if we need to refresh
^ all datastore info
o used – output used space instead of free
o breif – list only alerting volumes
o blacklistregexp – whether to treat blacklist as regexp
b – blacklist VMFS’s
T (value) – timeshift to detemine if we need to refresh
* runtime – shows runtime info
+ list(vm) – list of VMWare machines and their statuses
+ listhost – list of VMWare esx host servers and their statuses
+ listcluster – list of VMWare clusters and their statuses
+ tools – VMWare Tools status
b – blacklist VM’s
+ status – overall object status (gray/green/red/yellow)
+ issues – all issues for the host
b – blacklist issues
^ all runtime info(except cluster and tools and no thresholds)
* recommendations – shows recommendations for cluster
+ (name) – recommendations for cluster with name (name)
^ all clusters recommendations
Cluster specific :
* cpu – shows cpu info
+ usage – CPU usage in percentage
+ usagemhz – CPU usage in MHz
^ all cpu info
* mem – shows mem info
+ usage – mem usage in percentage
+ usagemb – mem usage in MB
+ swap – swap mem usage in MB
o listvm – turn on/off output list of swapping VM’s
+ memctl – mem used by VM memory control driver(vmmemctl) that controls ballooning
o listvm – turn on/off output list of ballooning VM’s
^ all mem info(plus overhead and no thresholds)
* cluster – shows cluster services info
+ effectivecpu – total available cpu resources of all hosts within cluster
+ effectivemem – total amount of machine memory of all hosts in the cluster
+ failover – VMWare HA number of failures that can be tolerated
+ cpufainess – fairness of distributed cpu resource allocation
+ memfainess – fairness of distributed mem resource allocation
^ only effectivecpu and effectivemem values for cluster services
* runtime – shows runtime info
+ list(vm) – list of VMWare machines in cluster and their statuses
+ listhost – list of VMWare esx host servers in cluster and their statuses
+ status – overall cluster status (gray/green/red/yellow)
+ issues – all issues for the cluster
b – blacklist issues
^ all cluster runtime info
* vmfs – shows Datastore info
+ (name) – free space info for datastore with name (name)
o used – output used space instead of free
o breif – list only alerting volumes
o regexp – whether to treat name as regexp
o blacklistregexp – whether to treat blacklist as regexp
b – blacklist VMFS’s
T (value) – timeshift to detemine if we need to refresh
^ all datastore info
o used – output used space instead of free
o breif – list only alerting volumes
o blacklistregexp – whether to treat blacklist as regexp
b – blacklist VMFS’s
T (value) – timeshift to detemine if we need to refresh
Copyright (c) 2008 op5
[/Expand]
Das check_vmware_api Script fügt ihr nun im Nagios bzw. Centreon unter Commands/Checks hinzu, unter Angabe der gewollten Parameter, wodurch ihr dann auch die Service Checks erstellen könnt.
centreon-command-esxi
In den Graphen sieht es dann so aus:
esxi-nagios-cpu

Error 29102 – VMware vCenter 5.1 Upgrade

Beim Upgrade des vCenter von Version 5.0 auf die aktuelle Version 5.1 Update 1 sind wir auf folgenden Fehler gestoßen:

Error 29102. Could not contact Lookup Service. Check VM_ssoreg.log in system teporary folder for details

vcenter-update-error
 
Im Log konnte man nur herauslesen, dass der Installer beim Registrieren mit dem SSO Server in einen Timeout läuft.
Also überprüfen ob die beiden Dienste laufen:
– VMware vCenter Inventory Service
– vCenter Single Sign On
Überprüfen ob die Dienste erreichbar sind:
Single Sign On: https://SSO_host_FQDN_or_IP:7444/lookupservice/sdk
Inventory Service: https://vCenter_host_FQDN_or_IP:10443/
In meinem Fall lief der Inventory Service einfach nicht. Dienst gestartet und das Setup erneut durchgeführt. Erfolgreich 😉

Installieren von aktuellen VMware Tools trotz altem ESXi Patchstand

In manchen Situationen ist es ganz gut, wenn man schon vorab die VMware Tools aktualisieren könnte, noch bevor man den esxi-Host gepatcht hat.
Mit etwas entpack arbeit ist es auch ohne weiteres möglich. Doch warum sollte man das machen?
Der normale Update-Prozess sieht vor dass zuerst die ESXi-Hosts aktualisiert werden. Daraufhin stehen den auf dem Host befindlichen Virtuellen Maschinen auch die aktuellen VMware-Tools zur Installation zur Verfügung.
Die VMware-Tools sind aber abwärts kompatibel (bis ESX/i 3.5), was bedeutet man kann Problemlos auch vorab die VMware-Tools auf VM’s von „älteren“ bzw. ungepatchten ESXi-Hosts installieren.
Damit könnte man zum Beispiel in den Genuss eines netten Features von vSphere 5.1 kommen, dass eine VM nicht mehr zwingend neugestartet muss. (Beim VMware-Tools updaten)
Also genug erzählt – wie kommt man an die aktuellen VMware-Tools?
Schritt 1: Download des ESXi-Patch via: http://www.vmware.com/patchmgr/download.portal
Update: 15.03.2015 – Es gibt auch noch ein anderes Repository: https://packages.vmware.com/tools/esx/
esxi-tools-download

Lade euch den aktuellsten Patch von der Hostupdate Seite bei VMware herunter. Im Moment ist das bei mir die „ESXi510-201212001
Sollte eine neuere Version vorhanden sein, wo in der Description „Updates tools-light“ inkludiert ist, dann ladet euch diese Version herunter.
Schritt 2: Heruntergeladenes Zip entpacken
Anschließend muss das .zip entpackt werden. (Ich empfehle 7Zip!) Unter vib20\tools-light findet ihr eine oder mehrere .vib Dateien welche wiederum weiter entpackt werden können.
Sollten mehrere vib Dateien enthalten sein enthält das Paket mit der größeren Build-Nummer (in dem Beispiel: 914609) Security + Bugfixes. Das Paket mit der kleineren Build-Nummer enthält lediglich Securityfixes.
Schlussendlich findet man die Setupdateien für Windows in folgender Unterstruktur:

ESXi510-201212001.zip\vib20\tools-light\VMware_locker_tools-light_5.1.0-0.9.914609.vib\tools\tools-light.tgz.tmptar\5.1.0\vmtools\windows.iso\

extract-tools extract-tools-2 extract-tools-vib extract-tools-vib-2
3. Inhalt des (z.B.) windows.iso extrahieren und setup.exe starten
Dann ganz normal das Setup durchführen. Mehr gibt es nicht zu beachten.

VMware SSL Automation Tool – Erleichterung beim Verteilen von SSL-Zertifikaten?

VMware hat gestern ein nettes Tool veröffentlicht, was den Aufwand beim Austauschen der SSL-Zertifikate (die mittlerweile immer mehr Bedeutung haben…) etwas minimieren soll.
Um das einzelne erstellen jedes Zertifikates kommt man allerdings noch nicht herum. Eine ausführliche Anleitung wie man zu den SSL-Zertifikaten kommt schrieb ich schon vergangenes Jahr.
Allerdings werden mit dem vCenter Certificate Automation Tool die Zertifikate automatisch hochgeladen bzw. ausgetauscht und die dazugehörigen Dienste automatisch neugestartet.
Es wird natürlich auch ein Backup der alten Zertifikate gemacht – und für den Notfall gibt es den Rollback Modus.
Unterstützt werden folgende Dienste / Server:
1. vCenter Server
2. vCenter Single Sign On
3. vCenter Inventory Service
4. vSphere Web Client
5. vCenter Log Browser
6. VMware Update Manager (VUM)
7. vCenter Orchestrator (VCO)
Noch mal ausdrücklich erwähnt: Das austauschen von Zertifikaten für ESXi Hosts wird NICHT unterstützt. Muss man klassisch machen.
Es wird empfohlen das Tool auszuführen nachdem man vom vCenter 4.x oder 5.0 zu 5.1 aktualisiert hat, oder bereits vCenter 5.1 im Einsatz hat und plant seine Zertifikate zu updaten.
Von VMware gibt es solch eine Anleitung ebfenfalls in Englisch: Generating certificates for use with the VMware SSL Certificate Automation Tool (2044696)
2041600_tool_session
Download gibts beim VMware hier: vCenter Certificate Automation Tool
Was man ebenfalls in naher Zukunft auf dem Radar behalten sollte ist der vCert Manager von vsslabs.

Diese wollen sich in Form eines Plugins im vCenter einnisten und ebenfalls den Prozess der Erneuerung von Zertifikaten komfortabler machen und beschleunigen. Ich habe mich bereits letztes Jahr schon in das „early adopter“ Programm eingeschrieben, aber bis heute noch keine Rückmeldung bekommen.
Mal schauen wann die Jungs die erste Beta veröffentlichen.
Einen ausführlichen Beitrag findet ihr hier: http://longwhiteclouds.com/2012/09/15/vcert-manager-changing-vmware-ssl-certs-made-easy/

Neustes VMware Fling – vCenter 5.1 Pre-Install Check Script

Es gibt wieder einmal ein kleines nettes Tool von VMware bezüglich der vCenter 5.1 installation.
Ich schrieb ja schon hier dass es mit dem Update auf 5.1 und die Einführung des Single-Sign-On-Servers bei vielen zu Problemen kam und das Update nicht auf die leichte Schulter zu nehmen ist.
Jedenfalls gibt es nun hier ein Tool mit dem ihr die Voraussetzungen eurer Umgebung prüfen könnt, um einem reibungsloses Update einen Schritt näher zu kommen 😉
Geprüft wird:

Operating System Checks
Active Directory Domain Checks
Active Directory Forest Checks
Time Synchronization Checks
Domain Name System (DNS) Resolution Checks
Port Checks
Domain Controller Checks
vCenter Server Authentication Checks

Es sind alles READ-ONLY Überprüfungen, sodass also keine Veränderung vorgenommen wird – und ihr das Tool vor einem Update unbedingt mal durchlaufen lassen solltet.

Ihr findet das Tool in Form eines Powershell Scriptes hier: http://labs.vmware.com/flings/vcenter-5-1-pre-install-check-script

Vmware View 5.1.2 – Performance Probleme mit dem View Agent

Wie eben bekannt wurde kann es zu Performance Problemen kommen, wenn man den View Agent 5.1.2 auf einer physikalischen Maschine verwendet. (KB2041977)
Virtuelle Maschinen sind von dem Problem nicht betroffen.
Anscheinend versucht der View Connection Server durchgehend den View Agent (einer physikalischen Maschine) zu konfigurieren, was nicht funktioniert und zu Performance Einbrüchen führt.
Vmware empfiehlt vorerst den View Agent nicht auf Version 5.1.2 zu aktualisieren und die Version 5.1.1 auf physikalischen Maschinen zu nutzen.  Dies wird auch supported wenn der Connection Server bereits auf Version 5.1.2 gepatcht wurde.
Kaum habe ich diesen Beitrag geschrieben lese ich auch, dass es wieder eine erneute Hotfix Version für’s vSphere / vCenter gibt.
Vmware vCenter Server Version 5.1.0B soll nun erneut weitere Bugs wie z.B „Timeouts beim einloggen mit dem vSphere Client“ beheben.
Die „VMware vCenter Server 5.1.0b Release Notes“ erstrecken sich aufgrund der vielen KB Einträge mittlerweile gedruckt auf 15 Seiten.

Vmware vSphere 5.1 – Single Sign On – Fazit

Ich bin gerade über einen auf den ersten Blick lustigen Beitrag über das neue Feature „Single Sign On“ gestoßen, der allerdings in Wirklichkeit nur widerspiegelt wie schlecht Vmware die Anwender auf das neue Produktfeature vorbereitet hat.
Es fing mit vielen Problemen beim Upgrade von 5.0 auf 5.1 an. Viele Anwender haben vermutlich das Ausmaß des Updates unterschätzt bzw. gab es auch einige Softwareseitige Probleme.
Jedenfalls auf die Frage eines Users „Wann gibt es endlich einen Best Practise Guide von Vmware für SSO“ hat sich Rick Blythe die Mühe gemacht und mal alle KB’s bezüglich SSO zusammengezählt.
Er kam auf sage und schreibe 65 Stück. Und das in nur 3 Monaten. Nicht schlecht.
vmwareSSO
Seht selbst:
https://blogs.vmware.com/kb/2012/12/where-is-the-best-practice-guide-for-sso.html