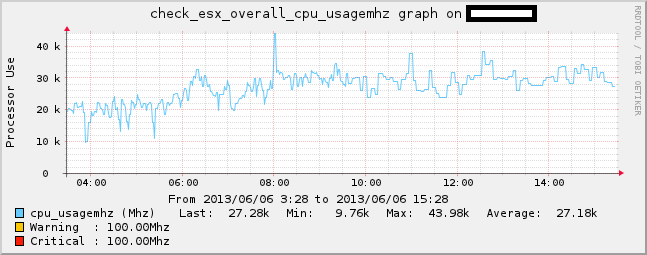
Ich arbeite schon seit mehreren Jahren mit Nagios vorallem aber mit der Oberfläche: Centreon. Wer Nagios noch per Shell bedient und somit hunderte Config-Files pflegt müsste Centreon eigentlich lieben.
Eine Oberfläche von der aus alles gesteuert wird. Komfortables anlegen von Hosts, Diensten und allen notwendigen Gruppen. Mit mehreren Klicks – keine Config-Files mehr – diese werden dann durch Centreon automatisch erstellt.
Zur grafischen Anzeige benutze ich Nagvis was noch die Erweiterung check_mk benötigt. Damit lassen sich dann nette Weathermaps erstellen oder den Serverraum in einem Bild mit dem dazugehörigen Host/Service-Status darstellen.
Als Betriebssystem nutze ich ausschließlich nur Ubuntu – daher ist das Komplettpaket „FAN – Fully automated Nagios“ (CentOS) für micht nicht interessant.
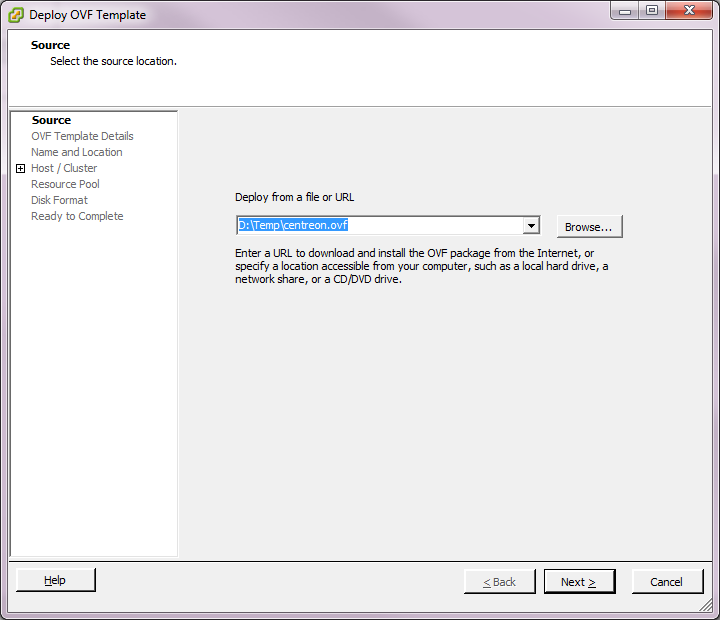
Hier ein Howto zur Installation von Nagios, Centreon, Check_MK und Nagvis. In naher Zukunft werde ich auch mal ein .OVF Template erstellen….
Vorraussetzungen:
-> Ubuntu 12.04 Server installiert.
Bevor wir anfangen noch obligatorisch die Updates machen:
apt-get update
apt-get upgrade
apt-get dist-upgrade
Notwendige Abhängigkeiten installieren:
apt-get install gcc make g++ lsb-release tofrodos apache2 apache2.2-common apache2-doc apache2-mpm-prefork apache2-utils libapache2-mod-python libexpat1 ssl-cert libapache2-mod-php5 php5 php5-common php5-gd php5-mysql php5-imap phpmyadmin php5-cli apache2-suexec php-pear php-auth php5-mcrypt mcrypt libapache2-mod-suphp php5-snmp php5-ldap mysql-server rrdtool librrds-perl libconfig-inifiles-perl libcrypt-des-perl libgd-gd2-perl snmp snmpd libnet-snmp-perl libsnmp-perl libgd2-xpm libgd2-xpm-dev bsd-mailx postfix
GGf. Vmware Tools installieren (VMware Tools mounten):
mkdir /mnt/cdrom
mount /dev/cdrom /mnt/cdrom
mount: blockorientiertes Gerät /dev/sr0 ist schreibgeschützt, wird eingehängt im Nur-Lese-Modus
tar xzfv /mnt/cdrom/VMwareTools-8.6.5-652272.tar.gz -C /tmp/
root@centreon:~# cd /tmp/vmware-tools-distrib/
./vmware-install.pl
Ich habe die VM-Tools mit Standardeinstellungen installiert. Anschließend Reboot:
shutdown -r now
GGf. Proxy im Wget eintragen:
vi /etc/wgetrc
Installation von Nagios:
Hier gibt es zwei Möglichkeiten. Entweder von Hand installieren, oder die fertigen Packete nutzen. Ich empfehle es von Hand zu installieren, da die Pakete oftmals nicht aktuell sind.
Also finger weg von: apt-get install nagios3 nagios-plugins
Nagios benutzer anlegen:
/usr/sbin/useradd -m -s /bin/bash nagios
passwd nagios
Gruppe anlegen:
/usr/sbin/groupadd nagios
Gruppe hinzufügen:
/usr/sbin/groupadd nagcmd
/usr/sbin/usermod -G nagcmd nagios
/usr/sbin/usermod -G nagcmd www-data
Nagios herunterladen:
wget http://downloads.sourceforge.net/project/nagios/nagios-3.x/nagios-3.4.1/nagios-3.4.1.tar.gz?r=http%3A%2F%2Fwww.nagios.org%2Fdownload%2Fcore%2Fthanks%2F&ts=1340721679&use_mirror=garr
mv nagios-3.4.1.tar.gz\?r\=http\:%2F%2Fwww.nagios.org%2Fdownload%2Fcore%2Fthanks%2F nagios-3.4.1.tar.gz
tar xzfv nagios-3.4.1.tar.gz
cd nagios/
Nagios Configurieren:
./configure --with-nagios-group=nagios --with-nagios-user=nagios --with-command-group=nagcmd
Creating sample config files in sample-config/ ...
[EXPAND Configuration Log]
*** Configuration summary for nagios 3.4.1 05-11-2012 ***:
General Options:
————————-
Nagios executable: nagios
Nagios user/group: nagios,nagios
Command user/group: nagios,nagcmd
Embedded Perl: no
Event Broker: yes
Install ${prefix}: /usr/local/nagios
Lock file: ${prefix}/var/nagios.lock
Check result directory: ${prefix}/var/spool/checkresults
Init directory: /etc/init.d
Apache conf.d directory: /etc/apache2/conf.d
Mail program: /bin/mail
Host OS: linux-gnu
Web Interface Options:
————————
HTML URL: http://localhost/nagios/
CGI URL: http://localhost/nagios/cgi-bin/
Traceroute (used by WAP):
Review the options above for accuracy. If they look okay,
type ‚make all‘ to compile the main program and CGIs.
root@centreon:/tmp/nagios#
*** Compile finished ***[/EXPAND]
Nagios installieren:
make all
make install
make install-commandmode
make install-config
make install-init
make install-webconf
Nagiosadmin (für Webinterface anlegen):
htpasswd -c /usr/local/nagios/etc/htpasswd.users nagiosadmin
New password:
Re-type new password:
Adding password for user nagiosadmin
Autostart hinzufügen:
ln -s /etc/init.d/nagios /etc/rcS.d/S99nagios
Nagios-Plugins installieren:
wget http://downloads.sourceforge.net/project/nagiosplug/nagiosplug/1.4.15/nagios-plugins-1.4.15.tar.gz?r=http%3A%2F%2Fwww.nagios.org%2Fdownload%2Fplugins%2F&ts=1340722460&use_mirror=dfn
mv nagios-plugins-1.4.15.tar.gz\?r\=http\:%2F%2Fwww.nagios.org%2Fdownload%2Fplugins%2F nagios-plugins-1.4.15.tar.gz
tar xzfv nagios-plugins-1.4.15.tar.gz
./configure
make
make install
Nagios starten:
/etc/init.d/nagios start
Mal die Webseite aufrufen: http://server/nagios
Benutzer: nagiosadmin
Prüfen ob Statusmap funktioniert.
Bei dem Fehler: The requested URL /nagios/cgi-bin/statusmap.cgi was not found on this server
Nochmal ausführen:
apt-get install libgd2-xpm libgd2-xpm-dev
root@centreon:/tmp/nagios# make cgis
cp /usr/nagios-3.2.3/cgi/*.cgi /usr/local/nagios/sbin
chown nagios:nagios /usr/local/nagios/sbin/*.cgi
Nagios neustarten
/etc/init.d/nagios restart
ndoutils installieren:
wget http://downloads.sourceforge.net/project/nagios/ndoutils-1.x/ndoutils-1.5.2/ndoutils-1.5.2.tar.gz?r=http%3A%2F%2Fsourceforge.net%2Fprojects%2Fnagios%2Ffiles%2Fndoutils-1.x%2Fndoutils-1.5.2%2F&ts=1340723870&use_mirror=garr
cd ndoutils-1.5.2/
./configure
make
make install
[EXPAND Setuplog]
/usr/bin/install -c -m 775 -o nagios -g nagios -d /usr/local/nagios/bin
/usr/bin/install -c -m 755 -o nagios -g nagios ndo2db-3x /usr/local/nagios/bin/ndo2db
/usr/bin/install -c -m 755 -o nagios -g nagios ndomod-3x.o /usr/local/nagios/bin/ndomod.o
/usr/bin/install -c -m 774 -o nagios -g nagios file2sock /usr/local/nagios/bin
/usr/bin/install -c -m 774 -o nagios -g nagios log2ndo /usr/local/nagios/bin
/usr/bin/install -c -m 774 -o nagios -g nagios sockdebug /usr/local/nagios/bin
Hint: NDOUtils Installation against Nagios v3.x
completed.
If you want to install NDOUtils for Nagios v2.x
please type ‚make install-2x
Next step should be the database initialization/upgrade
cd into the db/ directory and either:
./installdb (for a new installation) or:
./upgradedb (for an existing one)
make[1]: Verlasse Verzeichnis ‚/tmp/ndoutils-1.5.2/src‘
Main NDOUtils components installed[/EXPAND]
So nun kann Centeron installiert werden. Beachtet das hier ggf. eine direkte Internetverbindung benötigt wird, da durch das Setup einige PEAR Komponenten aktualisiert werden.
Centreon installieren:
wget http://download.centreon.com/index.php?id=181
mv index.php\?id\=181 centreon.2.3.8.tar.gz
tar xzfv centreon.2.3.8.tar.gz
./install.sh -i
[EXPAND Centreon Setup]
Do you accept GPL license ?
[y/n], default to [n]:
> y
————————————————————————
Please choose what you want to install
————————————————————————
Do you want to install : Centreon Web Front
[y/n], default to [n]:
> y
Do you want to install : Centreon CentCore
[y/n], default to [n]:
> y
Do you want to install : Centreon Nagios Plugins
[y/n], default to [n]:
> y
Do you want to install : Centreon Snmp Traps process
[y/n], default to [n]:
> y
————————————————————————
Start CentWeb Installation
————————————————————————
Where is your Centreon directory?
default to [/usr/local/centreon]
>
Do you want me to create this directory ? [/usr/local/centreon]
[y/n], default to [n]:
> y
Path /usr/local/centreon OK
Where is your Centreon log directory
default to [/usr/local/centreon/log]
>
Do you want me to create this directory ? [/usr/local/centreon/log]
[y/n], default to [n]:
> y
Path /usr/local/centreon/log OK
Where is your Centreon etc directory
default to [/etc/centreon]
>
Do you want me to create this directory ? [/etc/centreon]
[y/n], default to [n]:
> y
Path /etc/centreon OK
Where is your Centreon generation_files directory?
default to [/usr/local/centreon]
>
Path /usr/local/centreon OK
Where is your Centreon variable library directory?
default to [/var/lib/centreon]
>
Do you want me to create this directory ? [/var/lib/centreon]
[y/n], default to [n]:
> y
Path /var/lib/centreon OK
Where is your CentPlugins Traps binary
default to [/usr/local/centreon/bin]
>
Do you want me to create this directory ? [/usr/local/centreon/bin]
[y/n], default to [n]:
> y
Path /usr/local/centreon/bin OK
Where is the RRD perl module installed [RRDs.pm]
default to [/usr/lib/perl5/RRDs.pm]
>
Path /usr/lib/perl5 OK
/usr/bin/rrdtool OK
Where is mail binary
default to [/usr/bin/mail]
> /usr/bin/mailx
/usr/bin/mailx OK
Where is PEAR [PEAR.php]
default to [/usr/share/php/PEAR.php]
>
Path /usr/share/php OK
Where is installed Nagios ?
default to [/usr/local/nagios]
>
Path /usr/local/nagios OK
Where is your nagios config directory
default to [/usr/local/nagios/etc]
>
Path /usr/local/nagios/etc OK
Where is your Nagios var directory ?
default to [/usr/local/nagios/var]
>
Path /usr/local/nagios/var OK
Where is your Nagios plugins (libexec) directory ?
default to [/usr/local/nagios/libexec]
>
Path /usr/local/nagios/libexec OK
Where is your nagios binary ?
default to [/usr/local/nagios/bin/nagios]
>
/usr/local/nagios/bin/nagios OK
Where is your Nagios image directory ?
default to [/usr/local/nagios/share/images/logos]
>
Path /usr/local/nagios/share/images/logos OK
Where is your nagiostats binary ?
default to [/usr/local/nagios/bin/nagiostats]
>
/usr/local/nagios/bin/nagiostats OK
p1_file : /usr/local/nagios/bin/p1.pl OK
/usr/bin/php OK
/usr/bin/perl OK
Finding Apache group : www-data
Finding Apache user : www-data
Finding Nagios user : nagios
Finding Nagios group : nagios
Where is your NDO ndomod binary ?
default to [/usr/sbin/ndomod.o]
> /usr/local/nagios/bin/ndomod.o
/usr/local/nagios/bin/ndomod.o OK
————————————————————————
Configure Sudo
————————————————————————
Where is sudo configuration file
default to [/etc/sudoers]
>
/etc/sudoers OK
Nagios init script OK
Your sudo is not configured
Do you want me to configure your sudo ? (WARNING)
[y/n], default to [n]:
> y
Configuring Sudo OK
————————————————————————
Configure Apache server
————————————————————————
Do you want to add Centreon Apache sub configuration file ?
[y/n], default to [n]:
> y
Create ‚/etc/apache2/conf.d/centreon.conf‘ OK
Configuring Apache OK
Do you want to reload your Apache ?
[y/n], default to [n]:
> y
Reloading Apache service OK
Preparing Centreon temporary files
Change right on /usr/local/centreon/log OK
Change right on /etc/centreon OK
Change right on /usr/local/nagios/share/images/logos OK
Install nagios documentation OK
Change macros for insertBaseConf.sql OK
Change macros for php files OK
Change right on /usr/local/nagios/etc OK
Copy CentWeb in system directory
Install CentWeb (web front of centreon) OK
Install libraries OK
Copying libinstall OK
Change macros for centreon.cron OK
Install Centreon cron.d file OK
Change macros for centAcl.php OK
Change macros for downtimeManager.php OK
Change macros for eventReportBuilder.pl OK
Change macros for dashboardBuilder.pl OK
Install cron directory OK
Change right for eventReportBuilder.pl OK
Change right for dashboardBuilder.pl OK
————————————————————————
Pear Modules
————————————————————————
Check PEAR modules
PEAR 1.4.9 1.9.4 OK
DB 1.7.6 NOK
DB_DataObject 1.8.4 NOK
DB_DataObject_FormBuilder 1.0.0RC4 NOK
MDB2 2.0.0 NOK
Date 1.4.6 NOK
HTML_Common 1.2.2 NOK
HTML_QuickForm 3.2.5 NOK
HTML_QuickForm_advmultiselect 1.1.0 NOK
HTML_Table 1.6.1 NOK
Archive_Tar 1.1 1.3.7 OK
Auth_SASL 1.0.1 NOK
Console_Getopt 1.2 1.3.0 OK
Net_SMTP 1.2.8 NOK
Net_Socket 1.0.1 NOK
Net_Traceroute 0.21 NOK
Net_Ping 2.4.1 NOK
Validate 0.6.2 NOK
XML_RPC 1.4.5 NOK
SOAP 0.10.1 NOK
Log 1.9.11 NOK
Do you want me to install/upgrade your PEAR modules
[y/n], default to [y]:
> y
Upgrading PEAR modules
Installing PEAR modules
DB 1.7.6 OK
DB_DataObject 1.8.4 1.10.0 OK
DB_DataObject_FormBuilder 1.0.0RC4 1.0.2 OK
MDB2 2.0.0 2.4.1 OK
HTML_QuickForm_advmultiselect 1.1.0 1.5.1 OK
HTML_Table 1.6.1 1.8.3 OK
Auth_SASL 1.0.1 1.0.6 OK
Net_SMTP 1.2.8 1.6.1 OK
Net_Traceroute 0.21 0.21.3 OK
Net_Ping 2.4.1 2.4.5 OK
Validate 0.6.2 0.8.5 OK
XML_RPC 1.4.5 1.5.5 OK
SOAP 0.10.1 0.13.0 OK
Log 1.9.11 1.12.7 OK
Check PEAR modules
PEAR 1.4.9 1.9.4 OK
DB 1.7.6 1.7.14 OK
DB_DataObject 1.8.4 1.10.0 OK
DB_DataObject_FormBuilder 1.0.0RC4 1.0.2 OK
MDB2 2.0.0 2.4.1 OK
Date 1.4.6 1.4.7 OK
HTML_Common 1.2.2 1.2.5 OK
HTML_QuickForm 3.2.5 3.2.13 OK
HTML_QuickForm_advmultiselect 1.1.0 1.5.1 OK
HTML_Table 1.6.1 1.8.3 OK
Archive_Tar 1.1 1.3.7 OK
Auth_SASL 1.0.1 1.0.6 OK
Console_Getopt 1.2 1.3.0 OK
Net_SMTP 1.2.8 1.6.1 OK
Net_Socket 1.0.1 1.0.10 OK
Net_Traceroute 0.21 0.21.3 OK
Net_Ping 2.4.1 2.4.5 OK
Validate 0.6.2 0.8.5 OK
XML_RPC 1.4.5 1.5.5 OK
SOAP 0.10.1 0.13.0 OK
Log 1.9.11 1.12.7 OK
All PEAR modules OK
————————————————————————
Centreon Post Install
————————————————————————
Create /usr/local/centreon/www/install/install.conf.php OK
Create /etc/centreon/instCentWeb.conf OK
————————————————————————
Start CentStorage Installation
————————————————————————
Where is your Centreon Run Dir directory?
default to [/var/run/centreon]
>
Do you want me to create this directory ? [/var/run/centreon]
[y/n], default to [n]:
> y
Path /var/run/centreon OK
Where is your CentStorage binary directory
default to [/usr/local/centreon/bin]
>
Path /usr/local/centreon/bin OK
Where is your CentStorage RRD directory
default to [/var/lib/centreon]
>
Path /var/lib/centreon OK
Finding Nagios group : nagios
Finding Nagios user : nagios
Preparing Centreon temporary files
/tmp/centreon-setup exists, it will be moved…
install www/install/createTablesCentstorage.sql OK
Creating Centreon Directory ‚/var/lib/centreon/status‘ OK
Creating Centreon Directory ‚/var/lib/centreon/metrics‘ OK
Change macros for centstorage binary OK
Install CentStorage binary OK
Install library for centstorage OK
Change right : /var/run/centreon OK
Change macros for centstorage init script OK
Do you want me to install CentStorage init script ?
[y/n], default to [n]:
> y
CentStorage init script installed OK
Do you want me to install CentStorage run level ?
[y/n], default to [n]:
> y
update-rc.d: warning: /etc/init.d/centstorage missing LSB information
update-rc.d: see <http://wiki.debian.org/LSBInitScripts>
Adding system startup for /etc/init.d/centstorage …
/etc/rc0.d/K30centstorage -> ../init.d/centstorage
/etc/rc1.d/K30centstorage -> ../init.d/centstorage
/etc/rc6.d/K30centstorage -> ../init.d/centstorage
/etc/rc2.d/S40centstorage -> ../init.d/centstorage
/etc/rc3.d/S40centstorage -> ../init.d/centstorage
/etc/rc4.d/S40centstorage -> ../init.d/centstorage
/etc/rc5.d/S40centstorage -> ../init.d/centstorage
Configuration file /etc/centreon/conf.pm not found. Exiting.
CentStorage stop FAIL
Change macros for logAnalyser OK
Install logAnalyser OK
Change macros for nagiosPerfTrace OK
Install nagiosPerfTrace OK
Change macros for purgeLogs OK
Install purgeLogs OK
Change macros for purgeCentstorage OK
Install purgeCentstorage OK
Change macros for centreonPurge.sh OK
Install centreonPurge.sh OK
Change macros for centstorage.cron OK
Install CentStorage cron OK
Create /etc/centreon/instCentStorage.conf OK
————————————————————————
Start CentCore Installation
————————————————————————
Where is your CentCore binary directory
default to [/usr/local/centreon/bin]
>
Path /usr/local/centreon/bin OK
/usr/bin/ssh OK
/usr/bin/scp OK
Finding Nagios group : nagios
Finding Nagios user : nagios
Preparing Centreon temporary files
/tmp/centreon-setup exists, it will be moved…
Change CentCore Macro OK
Copy CentCore in binary directory OK
Change right : /var/run/centreon OK
Change right : /var/lib/centreon OK
Replace CentCore init script Macro OK
Do you want me to install CentCore init script ?
[y/n], default to [n]:
> y
CentCore init script installed OK
Do you want me to install CentCore run level ?
[y/n], default to [n]:
> y
update-rc.d: warning: /etc/init.d/centcore missing LSB information
update-rc.d: see <http://wiki.debian.org/LSBInitScripts>
Adding system startup for /etc/init.d/centcore …
/etc/rc0.d/K30centcore -> ../init.d/centcore
/etc/rc1.d/K30centcore -> ../init.d/centcore
/etc/rc6.d/K30centcore -> ../init.d/centcore
/etc/rc2.d/S40centcore -> ../init.d/centcore
/etc/rc3.d/S40centcore -> ../init.d/centcore
/etc/rc4.d/S40centcore -> ../init.d/centcore
/etc/rc5.d/S40centcore -> ../init.d/centcore
Create /etc/centreon/instCentCore.conf OK
————————————————————————
Start CentPlugins Installation
————————————————————————
Where is your CentPlugins lib directory
default to [/var/lib/centreon/centplugins]
>
Do you want me to create this directory ? [/var/lib/centreon/centplugins]
[y/n], default to [n]:
> y
Path /var/lib/centreon/centplugins OK
Finding Nagios user : nagios
Finding Nagios group : nagios
Preparing Centreon temporary files
/tmp/centreon-setup exists, it will be moved…
Change macros for CentPlugins OK
Installing the plugins OK
Change right on centreon.conf OK
CentPlugins is installed
————————————————————————
Start CentPlugins Traps Installation
————————————————————————
Where is your SNMP configuration directory
default to [/etc/snmp]
>
/etc/snmp OK
Where is your SNMPTT binaries directory
default to [/usr/local/centreon/bin/]
>
/usr/local/centreon/bin/ OK
Finding Nagios group : nagios
Finding Apache user : www-data
Preparing Centreon temporary files
/tmp/centreon-setup exists, it will be moved…
Change macros for CentPluginsTraps OK
Installing the plugins Trap binaries OK
Change macros for snmptrapd.conf OK
Change macros for snmptt.ini OK
Install : snmptrapd.conf OK
Install : snmp.conf OK
Install : snmptt.ini OK
Install : snmptt OK
Install : snmpttconvertmib OK
Create /etc/centreon/instCentPlugins.conf OK
###############################################################################
# #
# Go to the URL : http://centreon.domain.info/centreon/ #
# to finish the setup #
# #
# Report bugs at http://forge.centreon.com #
# #
# Thanks for using Centreon. #
# ———————– #
# Contact : infos@centreon.com #
# http://www.centreon.com #
# #
###############################################################################[/EXPAND]
Nun die Webseite aufrufen und mit der Installation weitermachen:
http://centreon.domain.info/centreon/
Anschließend Neustart:
shutdown -r now
Nachträglich die LDAP-Authentifizierung über die Centreon Oberfläche einrichten:
Administration - > Options -> Options -> Ldap
Wenn man nun noch Nagvis installieren will – gehts weiter.
Zuerst muss check_mk installiert werden:
wget http://mathias-kettner.de/download/check_mk-1.2.0p1.tar.gz
tar xzfv check_mk-1.2.0p1.tar.gz
cd check_mk-1.2.0p1
./setup.sh
Hier alles wieder mit Standart-Einstellungen installiert
[EXPAND check_MK Setup]
./setup.sh
Check_MK setup Version: 1.2.0p1
Welcome to Check_MK. This setup will install Check_MK into user defined
directories. If you run this script as root, installation paths below
/usr will be suggested. If you run this script as non-root user paths
in your home directory will be suggested. You may override the default
values or just hit enter to accept them.
Your answers will be saved to /home/centreon/.check_mk_setup.conf and will be
reused when you run the setup of this or a later version again. Please
delete that file if you want to delete your previous answers.
* Found running Nagios process, autodetected 18 settings.
1) Installation directories of check_mk
Executable programs
Directory where to install executable programs such as check_mk itself.
This directory should be in your search path ($PATH). Otherwise you
always have to specify the installation path when calling check_mk:
( default –> /usr/bin):
Check_MK configuration
Directory where check_mk looks for its main configuration file main.mk.
An example configuration file will be installed there if no main.mk is
present from a previous version:
( default –> /etc/check_mk):
Check_MK software
The base directory for the software installation of Check_MK. This
directory will get the subdirectories checks, modules, web, locale and
agents. Note: in previous versions it was possible to specify each of
those directories separately. This is no longer possible:
( default –> /usr/share/check_mk):
documentation
Some documentation about check_mk will be installed here. Please note,
however, that most of check_mk’s documentation is available only online at
http://mathias-kettner.de/check_mk.html:
( default –> /usr/share/doc/check_mk):
check manuals
Directory for manuals for the various checks. The manuals can be viewed
with check_mk -M <CHECKNAME>:
( default –> /usr/share/doc/check_mk/checks):
working directory of check_mk
check_mk will create caches files, automatically created checks and
other files into this directory. The setup will create several subdirectories
and makes them writable by the Nagios process:
( default –> /var/lib/check_mk):
2) Configuration of Linux/UNIX Agents
extensions for agents
This directory will not be created on the server. It will be hardcoded
into the Linux and UNIX agents. The agent will look for extensions in the
subdirectories plugins/ and local/ of that directory:
( default –> /usr/lib/check_mk_agent):
configuration dir for agents
This directory will not be created on the server. It will be hardcoded
into the Linux and UNIX agents. The agent will look for its configuration
files here (currently only the logwatch extension needs a configuration file):
( default –> /etc/check_mk):
3) Integration with Nagios
Name of Nagios user
The working directory for check_mk contains several subdirectories
that need to be writable by the Nagios user (which is running check_mk
in check mode). Please specify the user that should own those
directories:
( autodetected –> nagios):
User of Apache process
Check_MK WATO (Web Administration Tool) needs a sudo configuration,
such that Apache can run certain commands as root. If you specify
the correct user of the apache process here, then we can create a valid
sudo configuration for you later::
( autodetected –> www-data):
Common group of Nagios+Apache
Check_mk creates files and directories while running as nagios.
Some of those need to be writable by the user that is running the webserver.
Therefore a group is needed in which both Nagios and the webserver are
members (every valid Nagios installation uses such a group to allow
the web server access to Nagios‘ command pipe)::
( autodetected –> nagcmd):
Nagios binary
The complete path to the Nagios executable. This is needed by the
option -R/–restart in order to do a configuration check.:
( autodetected –> /usr/local/nagios/bin/nagios):
Nagios main configuration file
Path to the main configuration file of Nagios. That file is always
named ’nagios.cfg‘. The default path when compiling Nagios yourself
is /usr/local/nagios/etc/nagios.cfg. The path to this file is needed
for the check_mk option -R/–restart:
( autodetected –> /usr/local/nagios/etc/nagios.cfg):
Nagios object directory
Nagios‘ object definitions for hosts, services and contacts are
usually stored in various files with the extension .cfg. These files
are located in a directory that is configured in nagios.cfg with the
directive ‚cfg_dir‘. Please specify the path to that directory
(If the autodetection can find your configuration
file but does not find at least one cfg_dir directive, then it will
add one to your configuration file for your conveniance):
( autodetected –> /usr/local/nagios/etc/check_mk.d):
Nagios startskript
The complete path to the Nagios startskript is used by the option
-R/–restart to restart Nagios.:
( autodetected –> /etc/init.d/nagios):
Nagios command pipe
Complete path to the Nagios command pipe. check_mk needs write access
to this pipe in order to operate:
( autodetected –> /usr/local/nagios/var/rw/nagios.cmd):
Check results directory
Complete path to the directory where Nagios stores its check results.
Using that directory instead of the command pipe is faster.:
( default –> /usr/local/nagios/var/spool/checkresults):
Nagios status file
The web pages of check_mk need to read the file ’status.dat‘, which is
regularily created by Nagios. The path to that status file is usually
configured in nagios.cfg with the parameter ’status_file‘. If
that parameter is missing, a compiled-in default value is used. On
FHS-conforming installations, that file usually is in /var/lib/nagios
or /var/log/nagios. If you’ve compiled Nagios yourself, that file
might be found below /usr/local/nagios:
( autodetected –> /usr/local/nagios/var/status.log):
Path to check_icmp
check_mk ships a Nagios configuration file with several host and
service templates. Some host templates need check_icmp as host check.
That check plugin is contained in the standard Nagios plugins.
Please specify the complete path (dir + filename) of check_icmp:
( autodetected –> /usr/local/nagios/libexec/check_icmp):
4) Integration with Apache
URL Prefix for Web addons
Usually the Multisite GUI is available at /check_mk/ and PNP4Nagios
is located at /pnp4nagios/. In some cases you might want to define some
prefix in order to be able to run more instances of Nagios on one host.
If you say /test/ here, for example, then Multisite will be located
at /test/check_mk/. Please do not forget the trailing slash.:
( default –> /):
Apache config dir
Check_mk ships several web pages implemented in Python with Apache
mod_python. That module needs an apache configuration section which
will be installed by this setup. Please specify the path to a directory
where Apache reads in configuration files.:
( autodetected –> /etc/apache2/conf.d):
HTTP authentication file
Check_mk’s web pages should be secured from unauthorized access via
HTTP authenticaion – just as Nagios. The configuration file for Apache
that will be installed contains a valid configuration for HTTP basic
auth. The most conveniant way for you is to use the same user file as
for Nagios. Please enter your htpasswd file to use here:
( autodetected –> /usr/local/nagios/etc/htpasswd.users):
HTTP AuthName
Check_mk’s Apache configuration file will need an AuthName. That
string will be displayed to the user when asking for the password.
You should use the same AuthName as for Nagios. Otherwise the user will
have to log in twice:
( autodetected –> Nagios Access):
5) Integration with PNP4Nagios 0.6
PNP4Nagios templates
Check_MK ships templates for PNP4Nagios for most of its checks.
Those templates make the history graphs look nice. PNP4Nagios
expects such templates in the directory pnp/templates in your
document root for static web pages:
( default –> /usr/share/check_mk/pnp-templates):
6) Check_MK Livestatus Module
compile livestatus module
This version of Check_mk ships a completely new and experimental
Nagios event broker module that provides direct access to Nagios
internal data structures. This module is called the Check_MK Livestatus
Module. It aims to supersede status.dat and also NDO. Currenty it
is completely experimental and might even crash your Nagios process.
Nevertheless – The Livestatus Module does not only allow extremely
fast access to the status of your services and hosts, it does also
provide live data (which status.dat does not). Also – unlike NDO –
Livestatus does not cost you even measurable CPU performance, does
not need any disk space and also needs no configuration.
Please answer ‚yes‘, if you want to compile and integrate the
Livestatus module into your Nagios. You need ‚make‘ and the GNU
C++ compiler installed in order to do this:
( default –> yes):
check_mk’s binary modules
Directory for architecture dependent binary libraries and plugins
of check_mk:
( default –> /usr/lib/check_mk):
Unix socket for Livestatus
The Livestatus Module provides Nagios status data via a unix
socket. This is similar to the Nagios command pipe, but allows
bidirectional communication. Please enter the path to that pipe.
It is recommended to put it into the same directory as Nagios‘
command pipe:
( default –> /usr/local/nagios/var/rw/live):
Backends for other systems
Directory where to put backends and configuration examples for
other systems. Currently this is only Nagvis, but other might follow
later.:
( default –> /usr/share/check_mk/livestatus):
———————————————————————-
You have chosen the following directories:
Executable programs /usr/bin
Check_MK configuration /etc/check_mk
Check_MK software /usr/share/check_mk
documentation /usr/share/doc/check_mk
check manuals /usr/share/doc/check_mk/checks
working directory of check_mk /var/lib/check_mk
extensions for agents /usr/lib/check_mk_agent
configuration dir for agents /etc/check_mk
Name of Nagios user nagios
User of Apache process www-data
Common group of Nagios+Apache nagcmd
Nagios binary /usr/local/nagios/bin/nagios
Nagios main configuration file /usr/local/nagios/etc/nagios.cfg
Nagios object directory /usr/local/nagios/etc/check_mk.d
Nagios startskript /etc/init.d/nagios
Nagios command pipe /usr/local/nagios/var/rw/nagios.cmd
Check results directory /usr/local/nagios/var/spool/checkresults
Nagios status file /usr/local/nagios/var/status.log
Path to check_icmp /usr/local/nagios/libexec/check_icmp
URL Prefix for Web addons /
Apache config dir /etc/apache2/conf.d
HTTP authentication file /usr/local/nagios/etc/htpasswd.users
HTTP AuthName Nagios Access
PNP4Nagios templates /usr/share/check_mk/pnp-templates
compile livestatus module yes
check_mk’s binary modules /usr/lib/check_mk
Unix socket for Livestatus /usr/local/nagios/var/rw/live
Backends for other systems /usr/share/check_mk/livestatus
Proceed with installation (y/n)? y
(Compiling MK Livestatus…………………………………………………………………………………………………………………………………………………………………………………………………………………………………………………………………………………………………………………………………………………………………………………………………………………………………………………………………………………………………………………………………..)
Installation completed successfully.
Please restart Nagios and Apache in order to update/active check_mk’s web pages.
You can access the new Multisite GUI at http://localhost/check_mk/[/EXPAND]
Apache & Nagios neustarten:
service apache2 restart
service nagios3 restart
Prüfen ob Check_MK richtig funktioniert:
http://centreon.domain.info/check_mk/
Ich hatte hier schon öfters den Fehler das der Socket nicht funktioniert
Abhilfe hat folgendes gebracht:
/var/lib/nagios/
chmod 777 rw/ -R
vi /etc/group
Der nagios Gruppe noch www-data hinzufügen.
Nagvis Abhängigkeiten:
apt-get install graphviz graphviz-dev php5-gd php5-mysql php5-cli php5-common sqlite3 php5-sqlite
service apache2 restart
Nagivs installieren:
wget http://downloads.sourceforge.net/project/nagvis/NagVis%201.6/nagvis-1.6.6.tar.gz?r=http%3A%2F%2Fwww.nagvis.org%2Fdownloads&ts=1340725577&use_mirror=ignum
mv nagvis-1.6.6.tar.gz\?r\=http\:%2F%2Fwww.nagvis.org%2Fdownloads nagvis-1.6.6.tar.gz
tar xzfv nagvis-1.6.6.tar.gz
cd nagvis-1.6.6/
./install.sh
[EXPAND Navis Setup]
+——————————————————————————+
| Welcome to NagVis Installer 1.6.6 |
+——————————————————————————+
| This script is built to facilitate the NagVis installation and update |
| procedure for you. The installer has been tested on the following systems: |
| – Debian Etch, Hardy (4.0, 5.0) |
| – Ubuntu Hardy, Intrepid, Jaunty, Karmic, Lucid (8.04 to 10.04) |
| – SuSE Linux Enterprise Server 10 and 11 |
| |
| Similar distributions to the ones mentioned above should work as well. |
| That (hopefully) includes RedHat, Fedora, CentOS, OpenSuSE |
| |
| If you experience any problems using these or other distributions, please |
| report that to the NagVis team. |
+——————————————————————————+
| Do you want to proceed? [y]:
+——————————————————————————+
| Starting installation of NagVis 1.6.6 |
+——————————————————————————+
| OS : Ubuntu 12.04 LTS |
| |
+— Checking for tools ——————————————————-+
| Using packet manager /usr/bin/dpkg found |
| |
+— Checking paths ———————————————————–+
| Please enter the path to the nagios base directory [/usr/local/nagios]:
| nagios path /usr/local/nagios found |
| Please enter the path to NagVis base [/usr/local/nagvis]:
| |
+— Checking prerequisites —————————————————+
| PHP 5.3 found |
| PHP Module: gd 5.3 found |
| PHP Module: mbstring compiled_in found |
| PHP Module: gettext compiled_in found |
| PHP Module: session compiled_in found |
| PHP Module: xml compiled_in found |
| PHP Module: pdo compiled_in found |
| Apache mod_php found |
| Checking Backends. (Available: mklivestatus,ndo2db,ido2db,merlinmy) |
| Do you want to use backend mklivestatus? [y]:
| Do you want to use backend ndo2db? [n]:
| Do you want to use backend ido2db? [n]:
| Do you want to use backend merlinmy? [n]:
| Livestatus Socket (/usr/local/nagios/var/rw/live) MISSING |
| Valid socket formats are: tcp:127.0.0.1:7668 or unix:/path/to/live |
| Please enter your MKLivestatus socket: unix:/var/lib/nagios/rw/live
| Invalid socket format. Take a look above for valid formats. |
| PHP Module: sockets compiled_in found |
| Graphviz 2.26 found |
| Graphviz Module dot 2.26.3 found |
| Graphviz Module neato 2.26.3 found |
| Graphviz Module twopi 2.26.3 found |
| Graphviz Module circo 2.26.3 found |
| Graphviz Module fdp 2.26.3 found |
| SQLite 3.7 found |
| |
+— Trying to detect Apache settings —————————————–+
| Please enter the web path to NagVis [/nagvis]:
| Please enter the name of the web-server user [www-data]:
| Please enter the name of the web-server group [www-data]:
| create Apache config file [y]:
| |
+— Checking for existing NagVis ———————————————+
| |
+——————————————————————————+
| Summary |
+——————————————————————————+
| NagVis home will be: /usr/local/nagvis |
| Owner of NagVis files will be: www-data |
| Group of NagVis files will be: www-data |
| Path to Apache config dir is: /etc/apache2/conf.d |
| Apache config will be created: yes |
| |
| Installation mode: install |
| |
| Do you really want to continue? [y]:
+——————————————————————————+
| Starting installation |
+——————————————————————————+
| Creating directory /usr/local/nagvis… done |
| Creating directory /usr/local/nagvis/var… done |
| Creating directory /usr/local/nagvis/var/tmpl/cache… done |
| Creating directory /usr/local/nagvis/var/tmpl/compile… done |
| Creating directory /usr/local/nagvis/share/var… done |
| Copying files to /usr/local/nagvis… done |
| Creating directory /usr/local/nagvis/etc/profiles… done |
| Creating main configuration file… done |
| Adding MKLivestatus Backend… done |
| Adding webserver group to file_group… done |
| Creating web configuration file… done |
| Setting permissions for web configuration file… done |
| |
| |
| |
+— Setting permissions… —————————————————+
| /usr/local/nagvis/etc/nagvis.ini.php-sample done |
| /usr/local/nagvis/etc done |
| /usr/local/nagvis/etc/maps done |
| /usr/local/nagvis/etc/maps/* done |
| /usr/local/nagvis/etc/automaps done |
| /usr/local/nagvis/etc/automaps/* done |
| /usr/local/nagvis/etc/profiles done |
| /usr/local/nagvis/share/userfiles/images/maps done |
| /usr/local/nagvis/share/userfiles/images/maps/* done |
| /usr/local/nagvis/share/userfiles/images/shapes done |
| /usr/local/nagvis/share/userfiles/images/shapes/* done |
| /usr/local/nagvis/var done |
| /usr/local/nagvis/var/* done |
| /usr/local/nagvis/var/tmpl done |
| /usr/local/nagvis/var/tmpl/cache done |
| /usr/local/nagvis/var/tmpl/compile done |
| /usr/local/nagvis/share/var done |
| |
+——————————————————————————+
| Installation complete |
| |
| You can safely remove this source directory. |
| |
| For later update/upgrade you may use this command to have a faster update: |
| ./install.sh -n /usr/local/nagios -p /usr/local/nagvis -l „unix:/var/lib/nagios/rw/live“ -b mklivestatus -u www-data -g www-data -w /etc/apache2/conf.d -a y
| |
| What to do next? |
| – Read the documentation |
| – Maybe you want to edit the main configuration file? |
| Its location is: /usr/local/nagvis/etc/nagvis.ini.php |
| – Configure NagVis via browser |
| <http://localhost/nagvis/config.php> |
| – Initial admin credentials: |
| Username: admin |
| Password: admin |
+——————————————————————————+[/EXPAND]
Dateien für Troubleshooting:
Nagios Logfile:
/usr/local/nagios/var/nagios.log
/usr/local/nagios/var/status.log
Centreon Logfiles:
/usr/local/centreon/log
Nagvis Configfile:
/usr/local/nagvis/etc/nagvis.ini.php
MKLivestatus socket:
unix:/var/lib/nagios/rw/live
Pfad zu ndomod.o
/usr/local/nagios/bin/ndomod.o
Pfad zu Nagios Plugins:
/usr/local/nagios/libexec
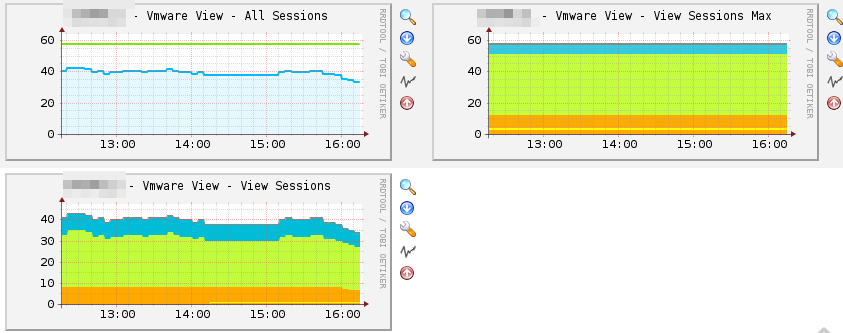
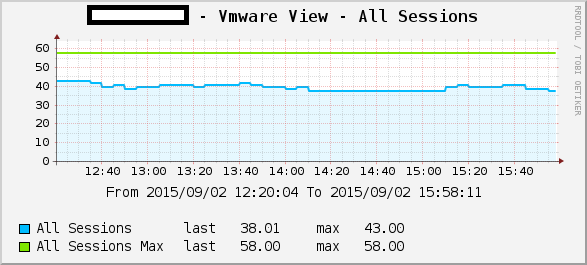
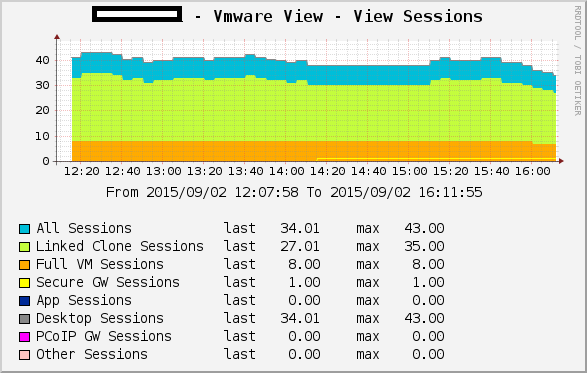
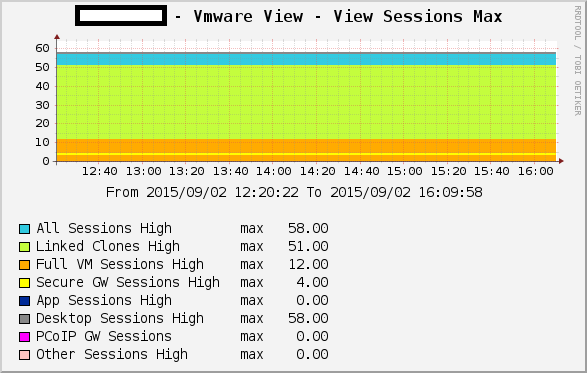
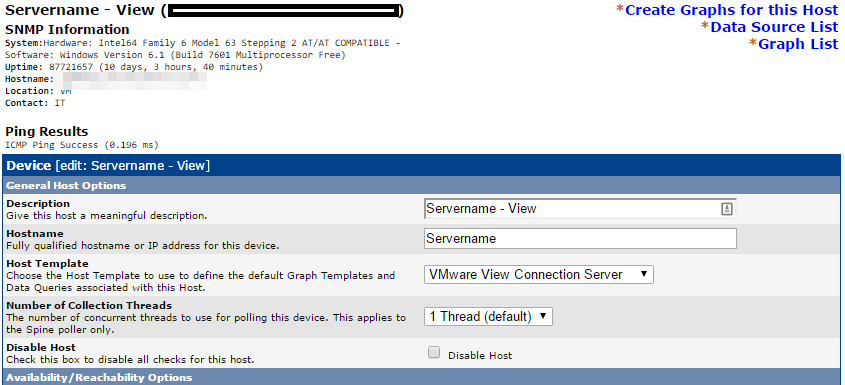
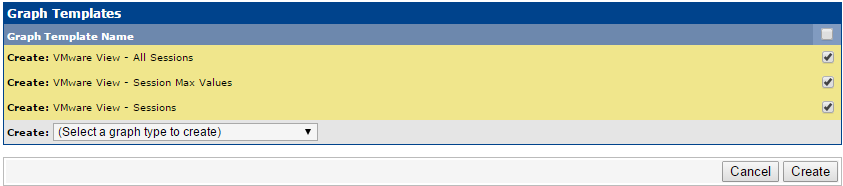
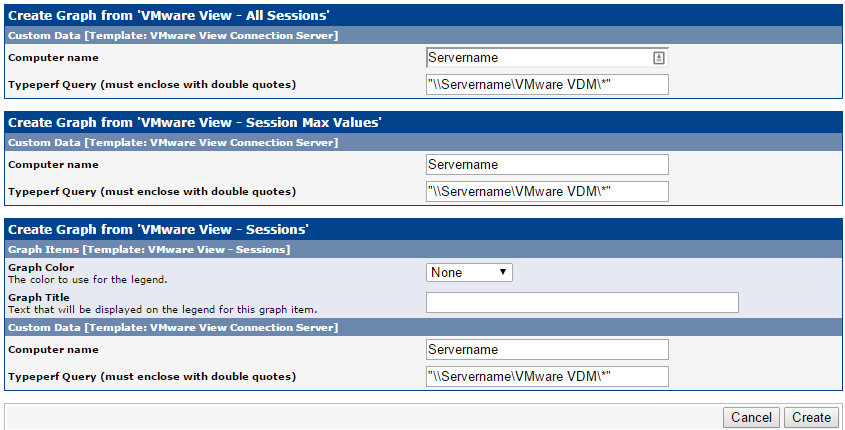
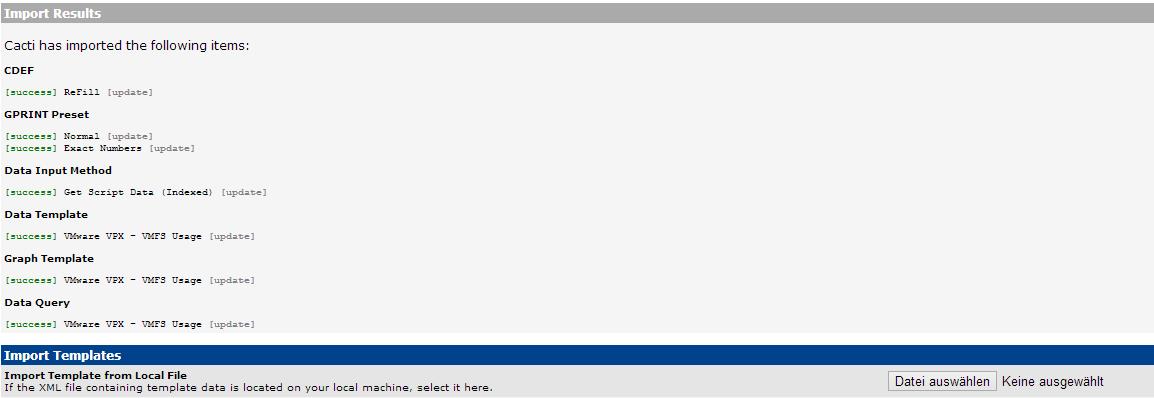
 Wie vielleicht so manche Beiträge hier vermuten lassen, setze ich VMware Horizon View zur Desktopbereitstellung ein. So hat sich mir die Frage gestellt ob man nicht die Anzahl an Connections, gestarteten Desktops etc. im MRTG bzw. Cacti überwachen kann.