VMware bietet mit seinem vSphere Client bzw. des vSphere Webclient eine schönes Tool zur Verwaltung der ESX Farm. Dort kann man sich auch die Performancewerte zu CPU, Ram, HDD, Netzwerk anschauen, Graphen erzeugen und vieles mehr…. Wer jetzt aber ein bestehendes System zum Monitoren hat, freut sich mit Sicherheit darüber, dort auch alle Systeme aufnehmen zu können.
Da seit dem ESX3 die SNMP Funktionalität bzw. alle nützlichen Attribute daraus gänzlich entfernt wurden, bleibt zum Abfragen nur die PowerCLI bzw. die Perl SDK. Wie das funktioniert beschreibe ich hier:
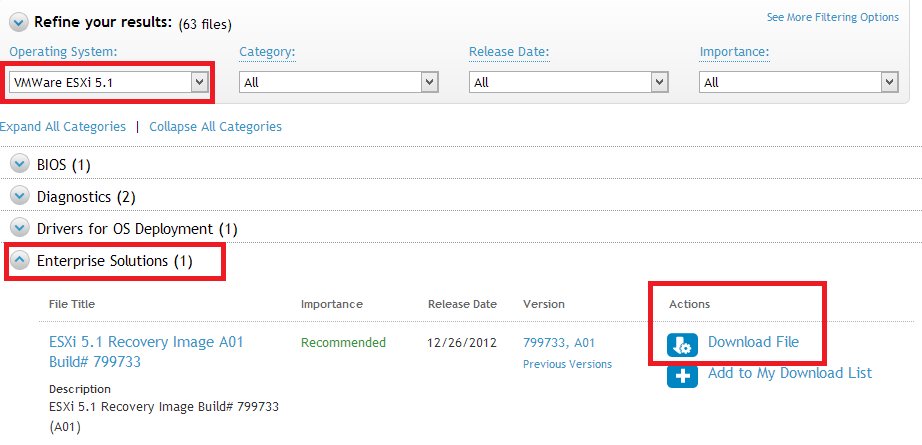
Als erstes die aktuellste VMware vSphere Perl SDK installieren. Momentan 5.1.0 – gibt’s bei VMware.
Entpacken:
tar xvf VMware-vSphere-Perl-SDK-5.1.0-780721.x86_64.tar.gz
Umgebungsvariablen setzen: (WICHTIG – ohne geht’s nicht!)
export http_proxy=
export ftp_proxy=
Installer ausführen:
sudo ./vmware-install.pl
Perl Module installieren:
perl -MCPAN -e shell
Anschließend für die unten aufgelisteten Module jeweils machen:
install XML::Simple
XML::Simple
Nagios::Plugin
Class::MethodMaker
URI
LWP
HTML::Parser
Das Nagios Plugin / Script herunterladen: check_vmware_api
Jetzt noch die SSL Überprüfung vom LWP Modul zu deaktivieren. Ich empfehle folgendes noch in den Kopfbereich des check_vmware_api Scriptes hinzuzufügen:
$ENV{PERL_LWP_SSL_VERIFY_HOSTNAME} = 0;
Alternativ kann man die Einstellung auch Global vornehmen:
sudo vim /usr/share/perl5/LWP/Protocol/https.pm
In der Datei nach der Zeile:
$ssl_opts{SSL_verify_mode} ||= 1;
suchen und diese durch folgende ersetzen:
$ssl_opts{SSL_verify_mode} ||= 0;
Ansonsten bekommt ihr eventuell folgende Fehlermeldung:
CHECK_ESX3.PL CRITICAL - Server version unavailable at 'https://MYESX:443/sdk/vimService.wsdl' at /usr/lib/perl5/5.10.0/VMware/VICommon.pm line 545.
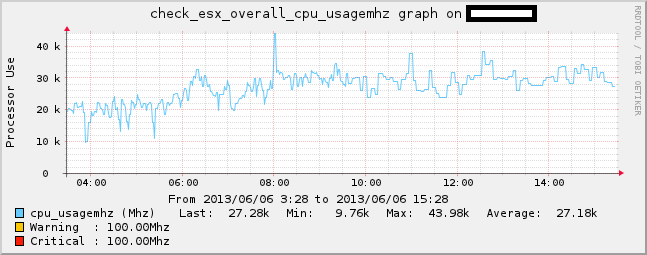
Zum Testen kann man sich nun mal den Gesamtverbrauch an CPU Ressourcen in MHZ ausgeben lassen:
root@SERVER:/# /usr/local/nagios/libexec/check_esx3.pl -D vcenter.domain.info -u user@domain.info -p password -l cpu -s usagemhz
CHECK_ESX3.PL OK - cpu usagemhz=31792.00 MHz | cpu_usagemhz=31792.00Mhz;;
Insgesamt gibt es sehr viele Optionen, die komplette Liste gibts hier:
[EXPAND check_vmware_api Befehle]
check_esx3.pl 0.7.0
This nagios plugin is free software, and comes with ABSOLUTELY NO WARRANTY.
It may be used, redistributed and/or modified under the terms of the GNU
General Public Licence (see http://www.fsf.org/licensing/licenses/gpl.txt).
VMWare Infrastructure plugin
Usage: check_esx3.pl -D <data_center> | -H <host_name> [ -C <cluster_name> ] [ -N <vm_name> ]
-u -p | -f
-l [ -s ] [ -T ] [ -i ]
[ -x <black_list> ] [ -o <additional_options> ]
[ -t ] [ -w <warn_range> ] [ -c <crit_range> ]
[ -V ] [ -h ]
-?, –usage
Print usage information
-h, –help
Print detailed help screen
-V, –version
Print version information
–extra-opts=[section][@file]
Read options from an ini file. See http://nagiosplugins.org/extra-opts
for usage and examples.
-H, –host=
ESX or ESXi hostname.
-C, –cluster=
ESX or ESXi clustername.
-D, –datacenter=
Datacenter hostname.
-N, –name=
Virtual machine name.
-u, –username=
Username to connect with.
-p, –password= Password to use with the username.
-f, –authfile= Authentication file with login and password. File syntax :
username=
password= -w, –warning=THRESHOLD
Warning threshold. See
http://nagiosplug.sourceforge.net/developer-guidelines.html#THRESHOLDFORMAT
for the threshold format.
-c, –critical=THRESHOLD
Critical threshold. See
http://nagiosplug.sourceforge.net/developer-guidelines.html#THRESHOLDFORMAT
for the threshold format.
-l, –command=COMMAND
Specify command type (CPU, MEM, NET, IO, VMFS, RUNTIME, …)
-s, –subcommand=SUBCOMMAND
Specify subcommand
-S, –sessionfile=SESSIONFILE
Specify a filename to store sessions for faster authentication
-x, –exclude=<black_list>
Specify black list
-o, –options=<additional_options>
Specify additional command options (quickstats, …)
-T, –timestamp=
Timeshift in seconds that could fix issues with „Unknown error“. Use values like 5, 10, 20, etc
-i, –interval=
Sampling Period in seconds. Basic historic intervals: 300, 1800, 7200 or 86400. See config for any changes.
Supports literval values to autonegotiate interval value: r – realtime interval, h – historical interval specified by position.
Default value is 20 (realtime). Since cluster does not have realtime stats interval other than 20(default realtime) is mandatory.
-M, –maxsamples=
Maximum number of samples to retrieve. Max sample number is ignored for historic intervals.
Default value is 1 (latest available sample).
–trace=
Set verbosity level of vSphere API request/respond trace
-t, –timeout=INTEGER
Seconds before plugin times out (default: 30)
-v, –verbose
Show details for command-line debugging (can repeat up to 3 times)
Supported commands(^ – blank or not specified parameter, o – options, T – timeshift value, b – blacklist) :
VM specific :
* cpu – shows cpu info
+ usage – CPU usage in percentage
+ usagemhz – CPU usage in MHz
+ wait – CPU wait time in ms
+ ready – CPU ready time in ms
^ all cpu info(no thresholds)
* mem – shows mem info
+ usage – mem usage in percentage
+ usagemb – mem usage in MB
+ swap – swap mem usage in MB
+ swapin – swapin mem usage in MB
+ swapout – swapout mem usage in MB
+ overhead – additional mem used by VM Server in MB
+ overall – overall mem used by VM Server in MB
+ active – active mem usage in MB
+ memctl – mem used by VM memory control driver(vmmemctl) that controls ballooning
^ all mem info(except overall and no thresholds)
* net – shows net info
+ usage – overall network usage in KBps(Kilobytes per Second)
+ receive – receive in KBps(Kilobytes per Second)
+ send – send in KBps(Kilobytes per Second)
^ all net info(except usage and no thresholds)
* io – shows disk I/O info
+ usage – overall disk usage in MB/s
+ read – read latency in ms (totalReadLatency.average)
+ write – write latency in ms (totalWriteLatency.average)
^ all disk io info(no thresholds)
* runtime – shows runtime info
+ con – connection state
+ cpu – allocated CPU in MHz
+ mem – allocated mem in MB
+ state – virtual machine state (UP, DOWN, SUSPENDED)
+ status – overall object status (gray/green/red/yellow)
+ consoleconnections – console connections to VM
+ guest – guest OS status, needs VMware Tools
+ tools – VMWare Tools status
+ issues – all issues for the host
^ all runtime info(except con and no thresholds)
Host specific :
* cpu – shows cpu info
+ usage – CPU usage in percentage
o quickstats – switch for query either PerfCounter values or Runtime info
+ usagemhz – CPU usage in MHz
o quickstats – switch for query either PerfCounter values or Runtime info
^ all cpu info
o quickstats – switch for query either PerfCounter values or Runtime info
* mem – shows mem info
+ usage – mem usage in percentage
o quickstats – switch for query either PerfCounter values or Runtime info
+ usagemb – mem usage in MB
o quickstats – switch for query either PerfCounter values or Runtime info
+ swap – swap mem usage in MB
o listvm – turn on/off output list of swapping VM’s
+ overhead – additional mem used by VM Server in MB
+ overall – overall mem used by VM Server in MB
+ memctl – mem used by VM memory control driver(vmmemctl) that controls ballooning
o listvm – turn on/off output list of ballooning VM’s
^ all mem info(except overall and no thresholds)
* net – shows net info
+ usage – overall network usage in KBps(Kilobytes per Second)
+ receive – receive in KBps(Kilobytes per Second)
+ send – send in KBps(Kilobytes per Second)
+ nic – makes sure all active NICs are plugged in
^ all net info(except usage and no thresholds)
* io – shows disk io info
+ aborted – aborted commands count
+ resets – bus resets count
+ read – read latency in ms (totalReadLatency.average)
+ write – write latency in ms (totalWriteLatency.average)
+ kernel – kernel latency in ms
+ device – device latency in ms
+ queue – queue latency in ms
^ all disk io info
* vmfs – shows Datastore info
+ (name) – free space info for datastore with name (name)
o used – output used space instead of free
o breif – list only alerting volumes
o regexp – whether to treat name as regexp
o blacklistregexp – whether to treat blacklist as regexp
b – blacklist VMFS’s
T (value) – timeshift to detemine if we need to refresh
^ all datastore info
o used – output used space instead of free
o breif – list only alerting volumes
o blacklistregexp – whether to treat blacklist as regexp
b – blacklist VMFS’s
T (value) – timeshift to detemine if we need to refresh
* runtime – shows runtime info
+ con – connection state
+ health – checks cpu/storage/memory/sensor status
o listitems – list all available sensors(use for listing purpose only)
o blackregexpflag – whether to treat blacklist as regexp
b – blacklist status objects
+ storagehealth – storage status check
o blackregexpflag – whether to treat blacklist as regexp
b – blacklist status objects
+ temperature – temperature sensors
o blackregexpflag – whether to treat blacklist as regexp
b – blacklist status objects
+ sensor – threshold specified sensor
+ maintenance – shows whether host is in maintenance mode
+ list(vm) – list of VMWare machines and their statuses
+ status – overall object status (gray/green/red/yellow)
+ issues – all issues for the host
b – blacklist issues
^ all runtime info(health, storagehealth, temperature and sensor are represented as one value and no thresholds)
* service – shows Host service info
+ (names) – check the state of one or several services specified by (names), syntax for (names):,,…,
^ show all services
* storage – shows Host storage info
+ adapter – list bus adapters
b – blacklist adapters
+ lun – list SCSI logical units
b – blacklist LUN’s
+ path – list logical unit paths
b – blacklist paths
^ show all storage info
* uptime – shows Host uptime
o quickstats – switch for query either PerfCounter values or Runtime info
* device – shows Host specific device info
+ cd/dvd – list vm’s with attached cd/dvd drives
o listall – list all available devices(use for listing purpose only)
DC specific :
* cpu – shows cpu info
+ usage – CPU usage in percentage
o quickstats – switch for query either PerfCounter values or Runtime info
+ usagemhz – CPU usage in MHz
o quickstats – switch for query either PerfCounter values or Runtime info
^ all cpu info
o quickstats – switch for query either PerfCounter values or Runtime info
* mem – shows mem info
+ usage – mem usage in percentage
o quickstats – switch for query either PerfCounter values or Runtime info
+ usagemb – mem usage in MB
o quickstats – switch for query either PerfCounter values or Runtime info
+ swap – swap mem usage in MB
+ overhead – additional mem used by VM Server in MB
+ overall – overall mem used by VM Server in MB
+ memctl – mem used by VM memory control driver(vmmemctl) that controls ballooning
^ all mem info(except overall and no thresholds)
* net – shows net info
+ usage – overall network usage in KBps(Kilobytes per Second)
+ receive – receive in KBps(Kilobytes per Second)
+ send – send in KBps(Kilobytes per Second)
^ all net info(except usage and no thresholds)
* io – shows disk io info
+ aborted – aborted commands count
+ resets – bus resets count
+ read – read latency in ms (totalReadLatency.average)
+ write – write latency in ms (totalWriteLatency.average)
+ kernel – kernel latency in ms
+ device – device latency in ms
+ queue – queue latency in ms
^ all disk io info
* vmfs – shows Datastore info
+ (name) – free space info for datastore with name (name)
o used – output used space instead of free
o breif – list only alerting volumes
o regexp – whether to treat name as regexp
o blacklistregexp – whether to treat blacklist as regexp
b – blacklist VMFS’s
T (value) – timeshift to detemine if we need to refresh
^ all datastore info
o used – output used space instead of free
o breif – list only alerting volumes
o blacklistregexp – whether to treat blacklist as regexp
b – blacklist VMFS’s
T (value) – timeshift to detemine if we need to refresh
* runtime – shows runtime info
+ list(vm) – list of VMWare machines and their statuses
+ listhost – list of VMWare esx host servers and their statuses
+ listcluster – list of VMWare clusters and their statuses
+ tools – VMWare Tools status
b – blacklist VM’s
+ status – overall object status (gray/green/red/yellow)
+ issues – all issues for the host
b – blacklist issues
^ all runtime info(except cluster and tools and no thresholds)
* recommendations – shows recommendations for cluster
+ (name) – recommendations for cluster with name (name)
^ all clusters recommendations
Cluster specific :
* cpu – shows cpu info
+ usage – CPU usage in percentage
+ usagemhz – CPU usage in MHz
^ all cpu info
* mem – shows mem info
+ usage – mem usage in percentage
+ usagemb – mem usage in MB
+ swap – swap mem usage in MB
o listvm – turn on/off output list of swapping VM’s
+ memctl – mem used by VM memory control driver(vmmemctl) that controls ballooning
o listvm – turn on/off output list of ballooning VM’s
^ all mem info(plus overhead and no thresholds)
* cluster – shows cluster services info
+ effectivecpu – total available cpu resources of all hosts within cluster
+ effectivemem – total amount of machine memory of all hosts in the cluster
+ failover – VMWare HA number of failures that can be tolerated
+ cpufainess – fairness of distributed cpu resource allocation
+ memfainess – fairness of distributed mem resource allocation
^ only effectivecpu and effectivemem values for cluster services
* runtime – shows runtime info
+ list(vm) – list of VMWare machines in cluster and their statuses
+ listhost – list of VMWare esx host servers in cluster and their statuses
+ status – overall cluster status (gray/green/red/yellow)
+ issues – all issues for the cluster
b – blacklist issues
^ all cluster runtime info
* vmfs – shows Datastore info
+ (name) – free space info for datastore with name (name)
o used – output used space instead of free
o breif – list only alerting volumes
o regexp – whether to treat name as regexp
o blacklistregexp – whether to treat blacklist as regexp
b – blacklist VMFS’s
T (value) – timeshift to detemine if we need to refresh
^ all datastore info
o used – output used space instead of free
o breif – list only alerting volumes
o blacklistregexp – whether to treat blacklist as regexp
b – blacklist VMFS’s
T (value) – timeshift to detemine if we need to refresh
Copyright (c) 2008 op5
[/Expand]
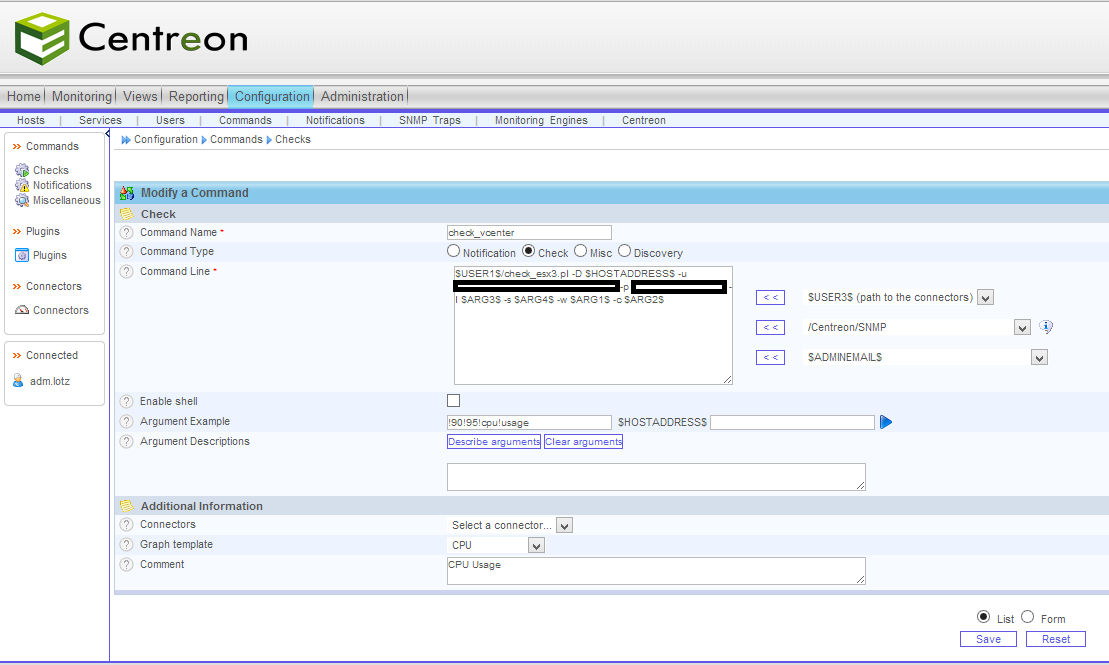
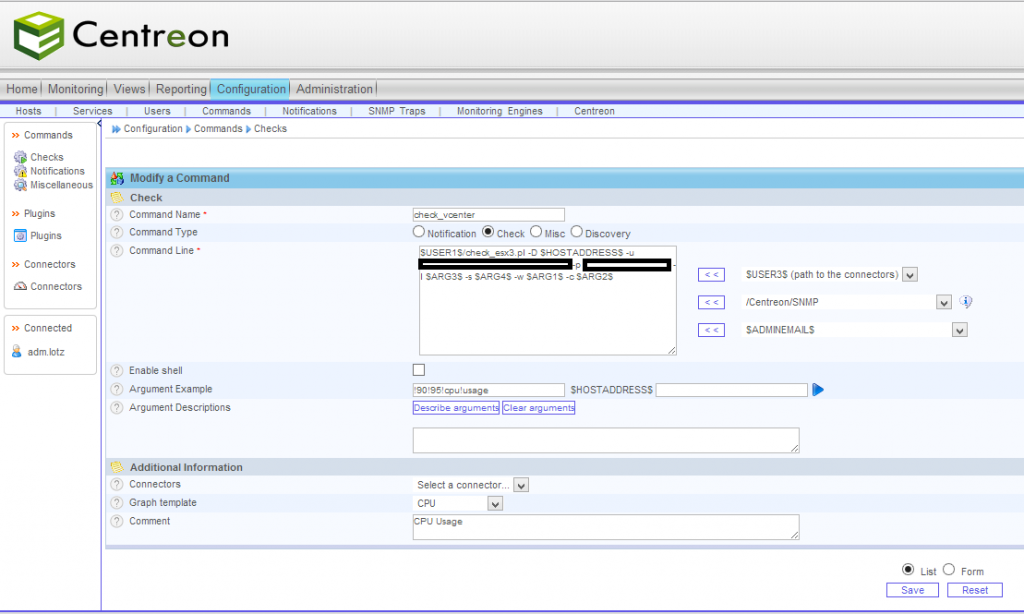
Das check_vmware_api Script fügt ihr nun im Nagios bzw. Centreon unter Commands/Checks hinzu, unter Angabe der gewollten Parameter, wodurch ihr dann auch die Service Checks erstellen könnt.
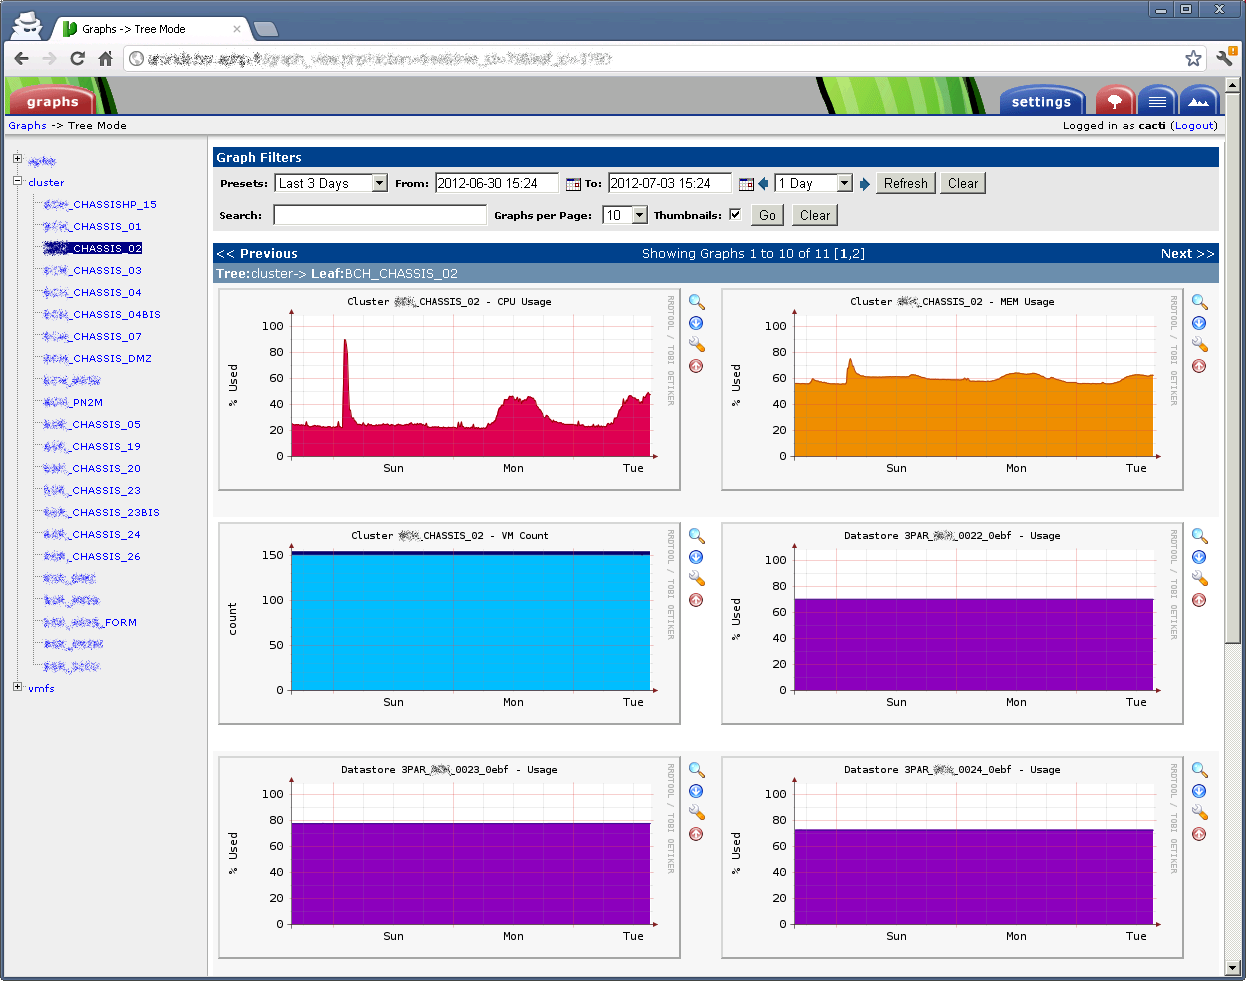
In den Graphen sieht es dann so aus: